Results Progression – Focus Consistency
(See Chart Features for general chart features - changing scales, copying to clipboard etc)
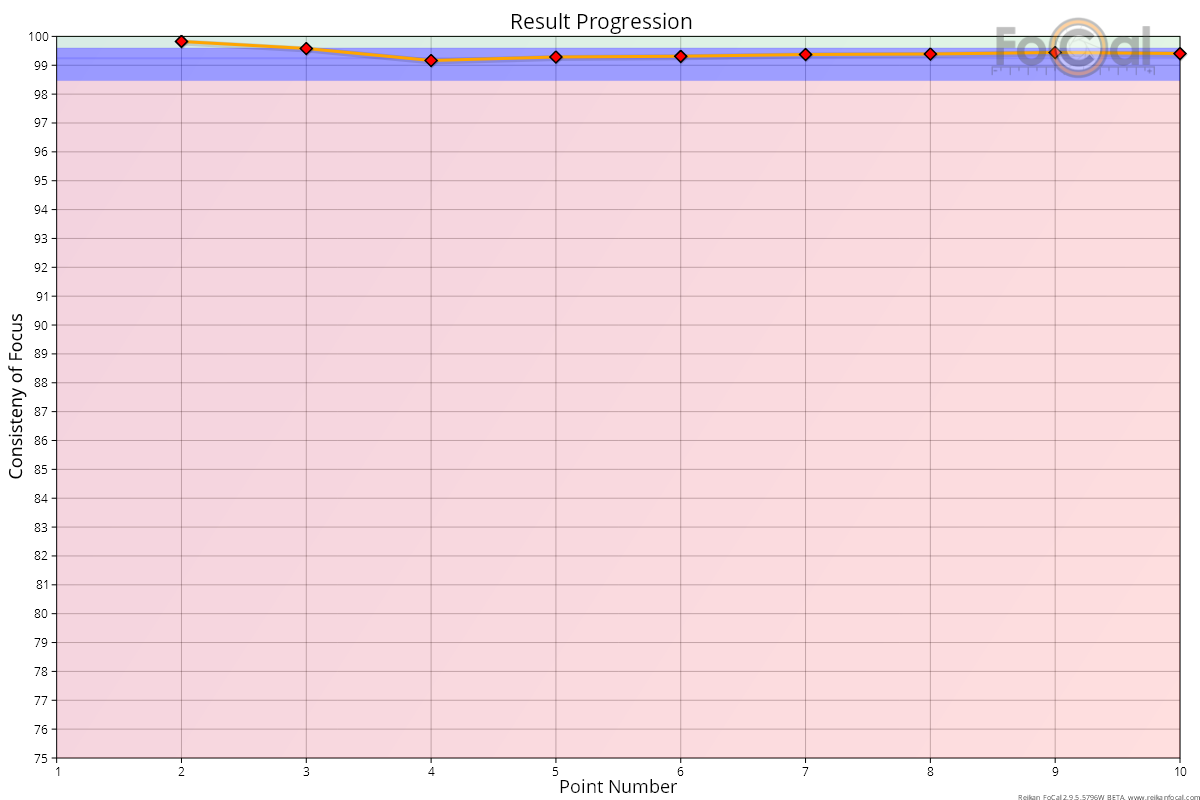
The Result Progression chart shows how the Consistency of Focus result changes through the test.
Key:
- Red diamond: unoptimised sharpness (Target Optimisation disabled)
- Green diamond: optimised sharpness (Target Optimisation enabled)
- Orange line – the sharpness value across the test
Where FoCal Comparison Data is available, the horizontal coloured bands indicate how this lens compares to other lenses of the same type on the same camera model:
- Green area - above average performance
- Blue area - average performance
- Red area - below average performance
Basic Interpretation
The value of each point is the CoF (Consistency of Focus) value calculated using only data up to that point. There is no value for the first point as you cannot determine consistency with a single sharpness measurement.
A good quality, well performing camera and lens would be expected to produce a value consistency above 97%, and the closer to 100% the better the equipment is performing.
Although focus calibration does not have a direct bearing on the consistency of focus, measurement of sharpness is more variable as an image becomes significantly blurred so you may see lower levels of Consistency of Focus with a poorly calibrated system. It’s always worth calibrating the AF system before running this test.
Further Details
FoCal Comparison Data Interpretation
The horizontal red, blue and green bands of the FoCal Comparison Data allow you to see how your lens is performing compared to the average values of other users of the same camera/lens combination.
The example above shows a well calibrated lens producing results comfortably in the blue area – i.e. comparable with the majority of typical camera/lenses of this type.
Quality of Focus – Focus Consistency | This Page | Astigmatism Factor – Focus Consistency