Dust Spot Aperture Range – Dust Analysis
The Dust Spot Aperture Range chart shows all detected high-confidence dust spots.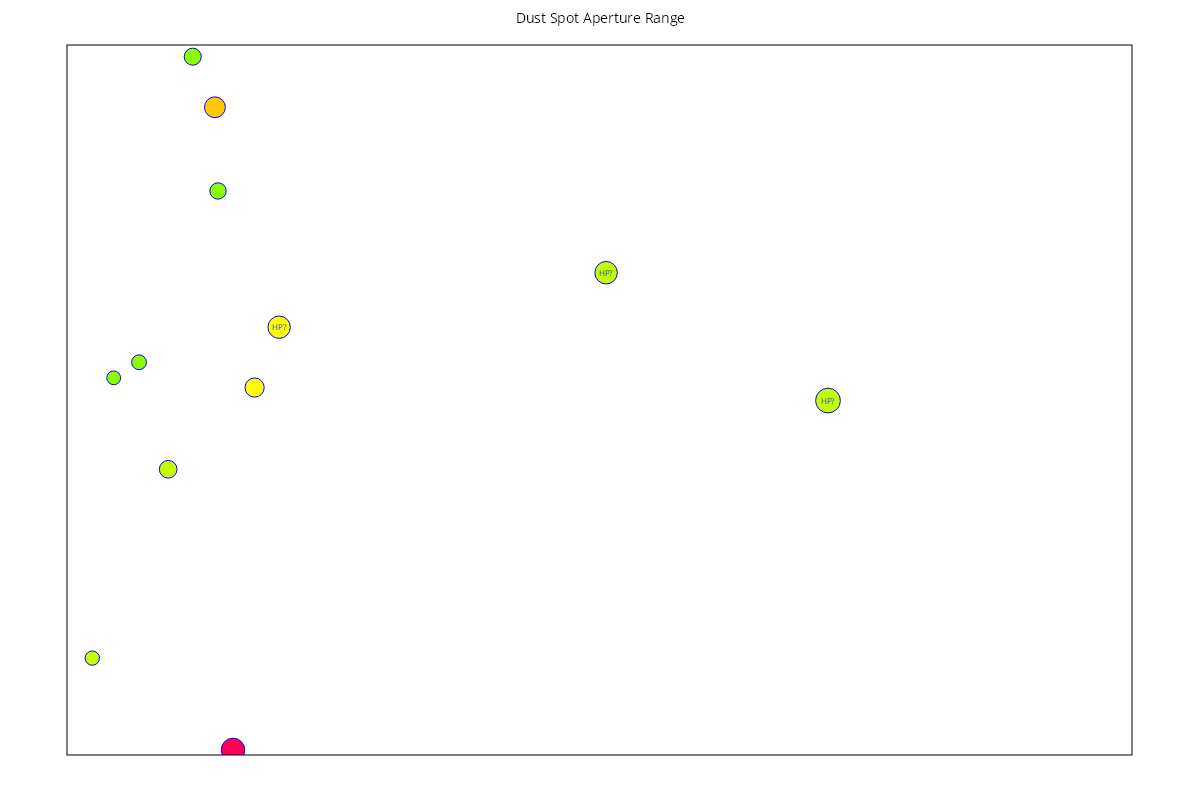
Key:
The colour of each spot indicates how many apertures this spot is detected over:
- Green spots are detected at a few apertures
- Yellow/Orange spots are detected at between 20% and 40% of the tested apertures.
- Red spots are detected at 50% or more of the tested apertures.
- Circles containing “HP?” are potential hot pixels rather than dust-spots.
Basic Interpretation
Detected spots are filtered by aperture, so if they do not appear in the same place over a range of apertures they will be ignored.
The size of each displayed dust spot is relative to the detected size of the spot. Note that the spots shown on this chart are considerably larger than real life in order to make them easier to see.
Generally, spots shown on the chart in green will only be noticeable on captured images when the lens is used at a high f-number (small aperture).
Within the FoCal application, if you click on any of these spots you will be able to see a crop of the image captured and should see the dust spot (as long as the image save option was enabled when the test was run).