Details - Calibration Check
The Calibration Check captures a lot of information, and the Details tab allows you to explore these in more depth:
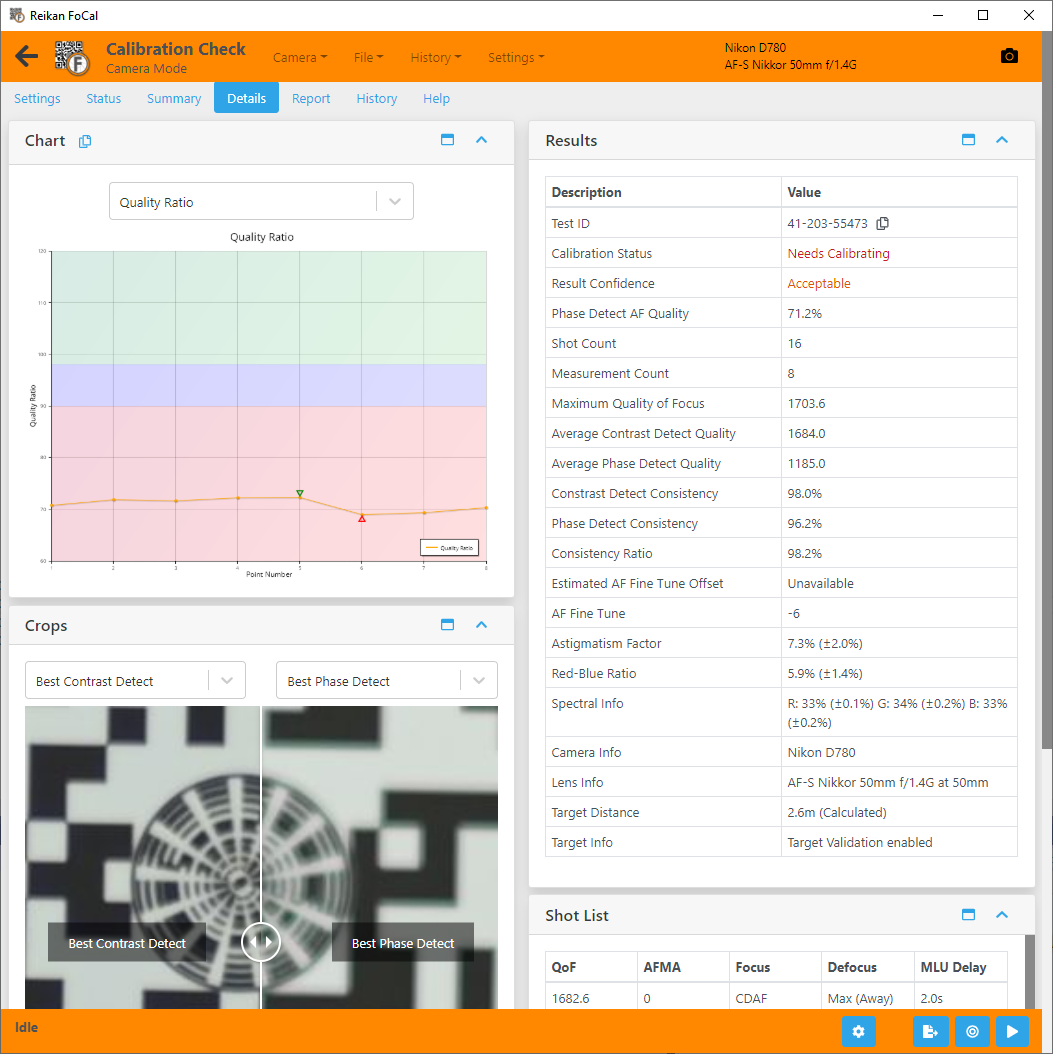
Test ID
A unique identifier for this particular test. You can use this when referencing the test – from within FoCal and if you have uploaded your results data from online* and with Reikan Support.
(* online features will be available in an upcoming release)
Calibration Status
This indicates the status of the calibration for this lens.
Result Confidence
This is a confidence level for the results. If the autofocus system behaviour is very erratic, the results may be low confidence indicating you need to use a more stable tripod, increase lighting level etc.
Phase Detect AF Quality
This is the comparison between the phase detect (non-Live View) and contrast detect (Live View) quality.
This test works by using the fact that contrast detect focusing is usually representative of the best quality achievable by the camera/lens.
The Phase Detect AF Quality measure indicates that phase detect autofocus is performing well or very well when this value is 100% or above, and poorer if the value is below about 98%.
Shot Count
The number of shots taken for this test - this is the number of actual pictures taken with the camera.
Measurement Count
The number of measurements made by this test. Each measurement requires 2 shots.
Maximum Quality of Focus
The absolute maximum measured Quality of Focus value, irrespective of the focus method used.
Average Live View AF Quality
The average quality level across all Live View shots.
Average Phase Detect Quality
The average quality level across all phase-detect shots.
Live View Consistency
The Consistency of Focus measurement across all Live View shots.
Phase Detect Consistency
The Consistency of Focus measurement across all phase detect shots.
Consistency Ratio
The ratio of the above Contrast Detect Consistency and Phase Detect Consistency, calculated as the Phase Detect Consistency divided by the Contrast Detect Consistency.
Values below 90% or above 110% can indicate poor consistency of either focus system. A value around 100% indicates that both focus systems are performing similarly which can indicate a more reliable result (even if the focusing itself is not particularly reliable).
Estimated AF Microadjustment Offset
If FoCal Comparison Data is available for this lens, an estimation of the distance from the correct focus adjustment value can be calculated based on the typical profile of this lens.
Note this is not the required focus adjustment value, but the offset from the correct value, not including any direction. For example, if the currently tests focus adjustment is +5 and the estimated offset is 10, then the actual required value is likely to be around +5 - 10 = -5, or +5 + 10 = +15.
Focus Adjustment
This is the focus adjustment value currently applied on the camera during this test.
Astigmatism Factor
Astigmatism Factor is a metric which indicates how the sharpness compares in two perpendicular axes of analysis. A value that deviates away from 0% can indicate asymmetrical lens distortion.
If the measure of sharpness in the horizontal direction is equal to the measure of sharpness in the vertical direction, the astigmatism factor will be 0%.
If the horizontal sharpness is higher than the vertical sharpness, the value will be above 0%, and if the vertical sharpness is higher than the horizontal sharpness, the value will be below 0%.
The percentage indicates how much sharper the sharpest axis is as a percentage. For example:
- if the horizontal measurement is 10% sharper than the vertical axis, the astigmatism factor would be +10%
- If the vertical measurement is 5% sharper than the horizontal axis, the astigmatism factor would be -5%
Red-Blue Ratio
This value indicates the quality measurement difference between the red and the blue channels. High values can indicate separation of colour channels (chromatic aberration) at the analysis region which would appear as fringing or false colouring.
If the measure of red quality is equal to the measure of blue quality the red-blue ratio will be 0%.
If the red quality is higher than the blue quality, the value will be above 0%, and if the blue quality is higher than the red quality, the value will be below 0%.
The percentage indicates how much higher the best quality is compared to the other. For example:
- if the red quality is 10% higher than the blue quality, the value would be +10%
- If the blue quality is 5% sharper than the red quality, the value would be -5%
Spectral Info
This value indicates the spectral content of the light used for analysis. Note that this will be the component powers (red, green, blue) as measured by the camera after image processing.
For JPEG modes, this value can be highly influenced by the internal processing engine of the camera.
For Raw, our processing compensates for per-channel attenuation from the colour filter array and tries to give a representative indication of actual lighting power, but accuracy will be dependent on how closely the selected colour temperature in the FoCal settings is to the actual lighting colour temperature.
Generally, this should just be used as an indication of approximately white lighting, with all three values around 33%. If one value is wildly away from 33% (e.g. >50% or <10%) any measurements are unlikely to be representative of “normal” shooting conditions.
Camera Info
This is information about the camera used for the testing, including temperature if available.
Lens Info
This is information about the lens used for the test, including focal length if available.
Target Distance
The calculated (by FoCal analysis of the target) or reported (from the camera) distance between the camera and the FoCal Target.
Note that distance calculation reports from the camera can be quite inaccurate. Also note that the Printed Target Size setting in FoCal Settings can alter the distance calculation results.
Target Info
Information about the target validation settings used for this test.
Target Validation confirms that the target is in the correct place, orientation etc and that nothing has significantly changed between shots.
Target Optimisation will make minor adjustments to the analysis position in order to compensate for any small movement of the image due to lens defects etc.