Quality Value – Calibration Check
(See Chart Features for general chart features - changing scales, copying to clipboard etc)
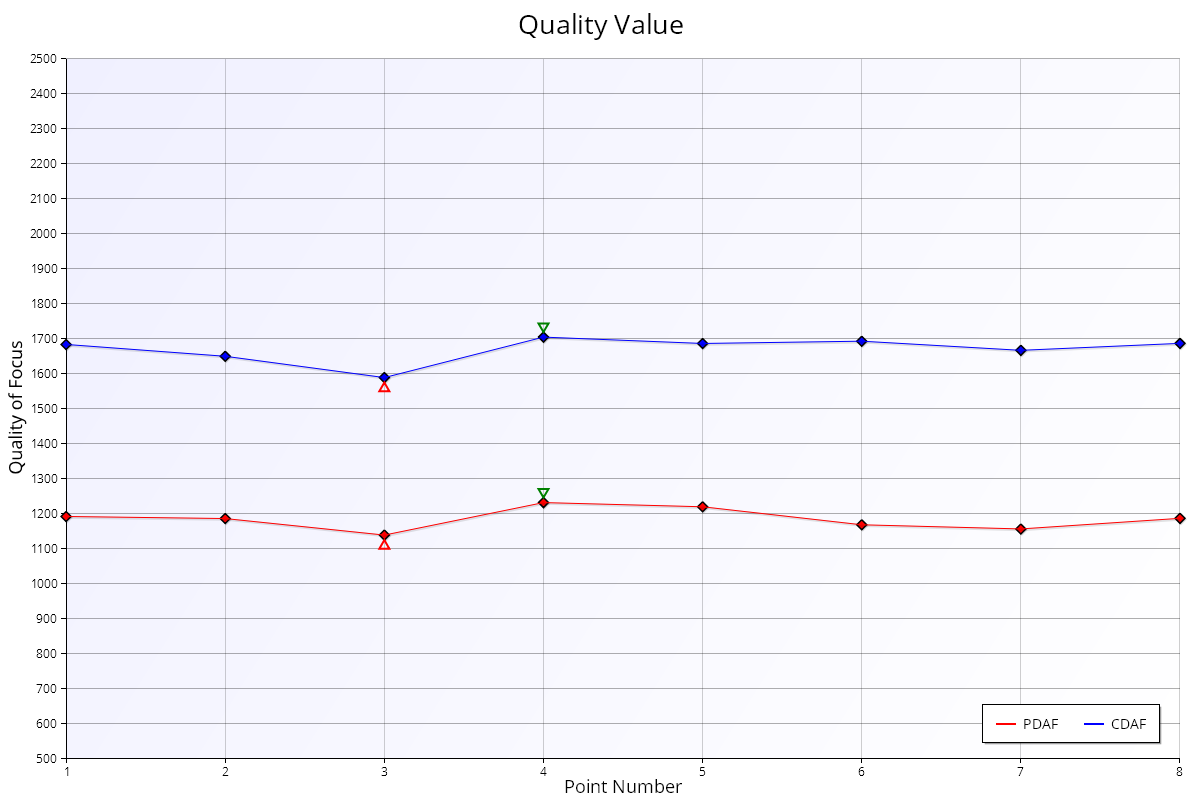
The Quality Value chart shows the quality values for phase detect and Live View measurements.
Interpretation
A well calibrated lens should show the red line (phase detect) at a similar or higher level than the blue line (Live View).