Chart Features
This page shows some general information about charts within FoCal.
Changing the chart scale
By default, most charts are shown to a specific scale to make for useful comparisons between lens and camera data:
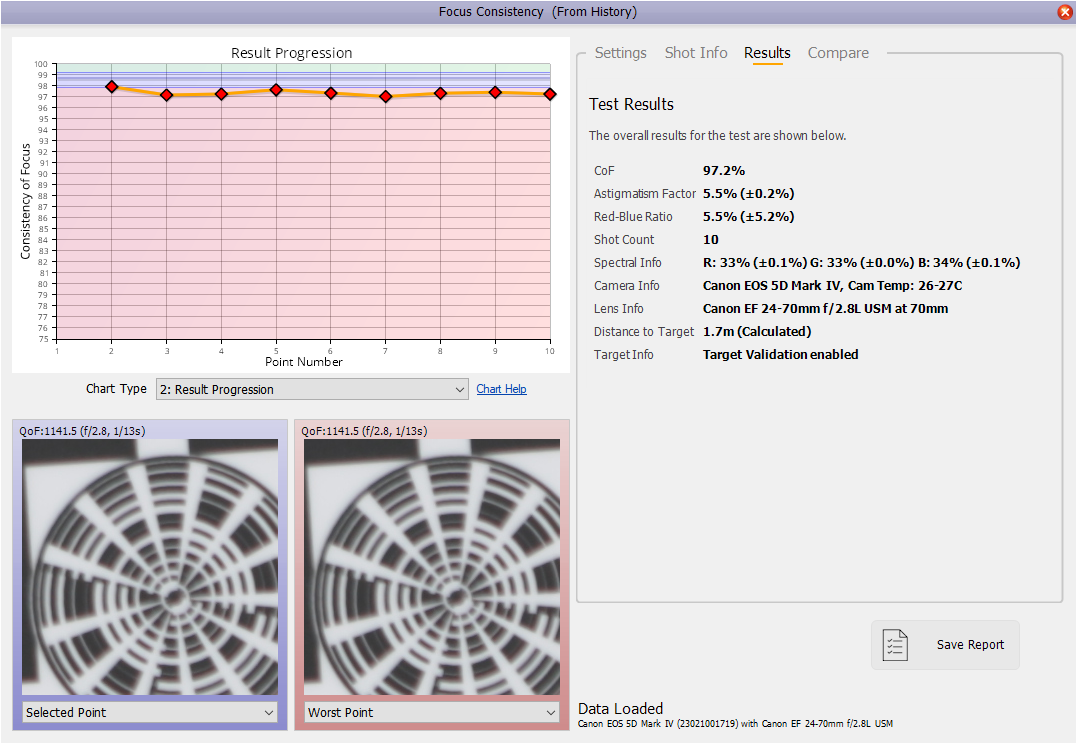
Whilst this gives a good overview of the results (for instance above you can see that the Focus Consistency results progression is around about 98%), it can be difficult to see the details of the data.
To change the scale to fit the data, you can click the numerical values on the Y axis. This will change the scale to better show the detail in the data:
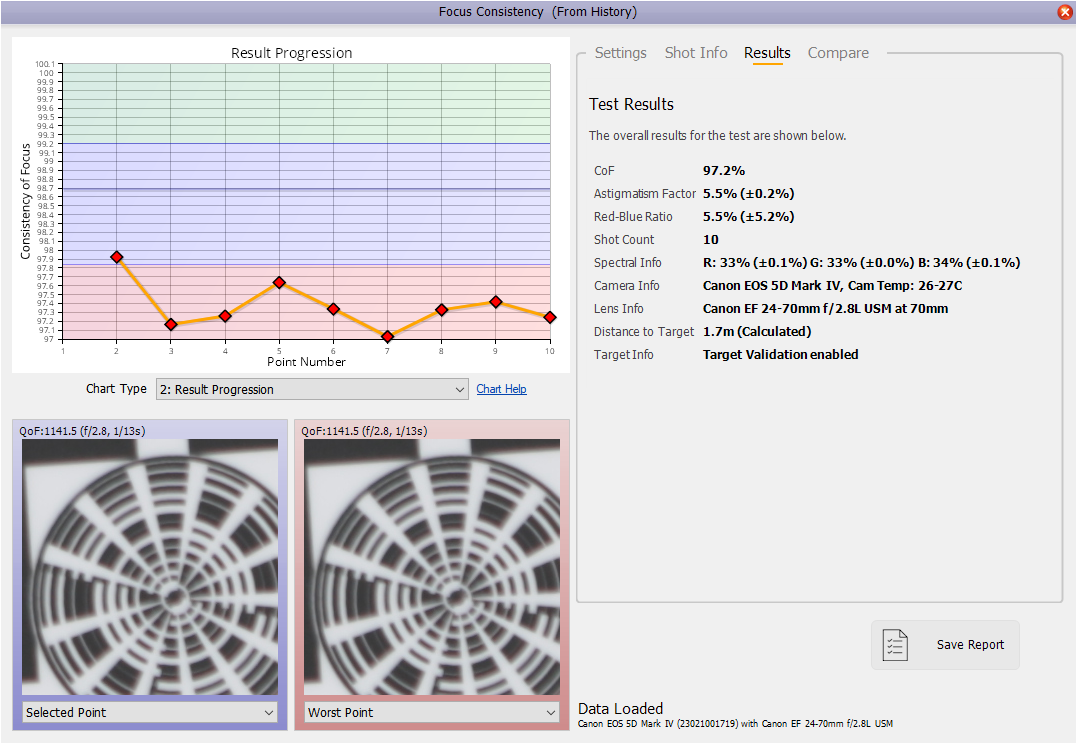
Clicking the Y axis numbers again will revert to the original scaling.
Reviewing Points
You can use the Z and X keys on the keyboard to move between points on the chart. The associated data within the Shot Info panel of a test will update as the point is selected.
Ignoring Points
On some tests, you can set points to be ignored within the calculations. To do this, use the right mouse button (or two-fingers on Mac trackpads) over a point marker. When ignored, the marker will be shown as white and this point will be removed from any overall result calculations.
The image below shows a Fully Auto calibration test re-opened from History with a few points ignored (the white points at AF Microadjustment -10).
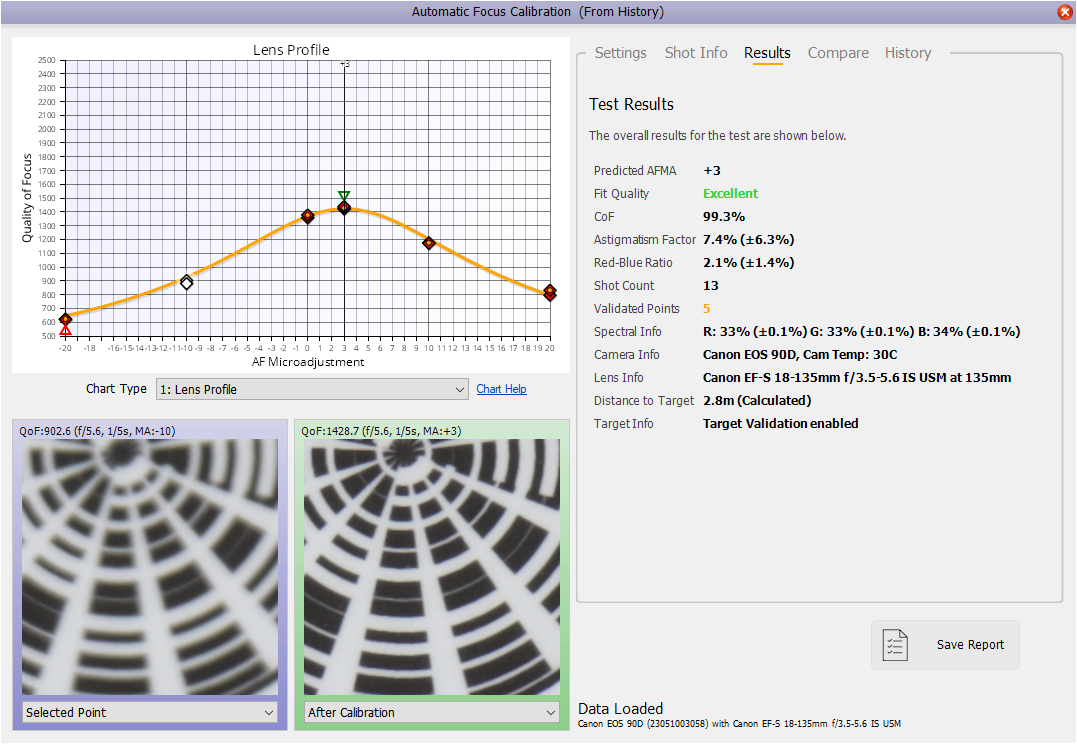
To re-enable points in the calculations, simple right-click again over the point.
If there are a number of overlapped (or almost overlapped) points, repeatedly right-clicking will toggle the ignore status of each point.
Copying to Clipboard
Hit Control and C to copy the chart to your computer’s clipboard. You can then paste the image into documents or websites for sharing.