Result Convergence - Fully Auto Calibration
(See Chart Features for general chart features - changing scales, copying to clipboard etc)
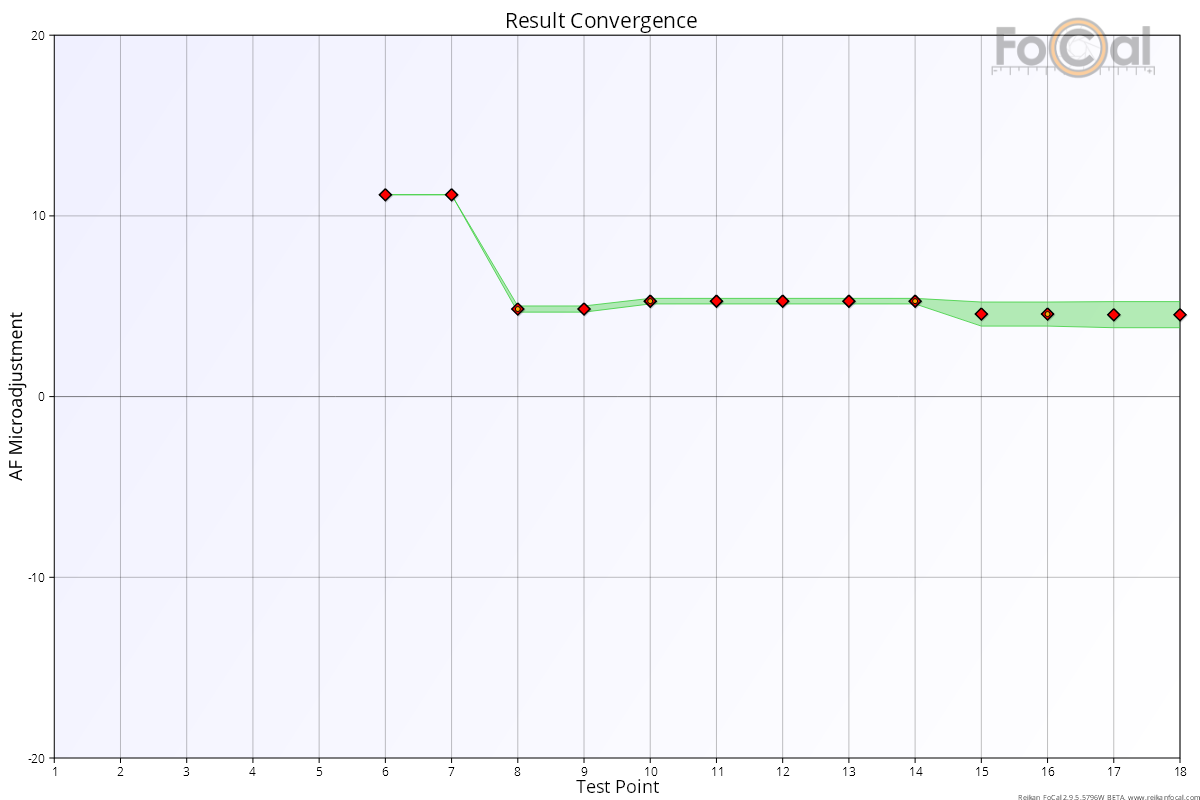
The Result Convergence chart indicates how FoCal determined the best AF Microadjustment value as more points were added to the data.
Key:
- Red diamond: unoptimised result (Target Optimisation disabled)
- Green diamond: optimised result (Target Optimisation enabled)
- Green area: shows the spread of potential result - the final results lies somewhere within this green area.
Basic Interpretation
There is no result for the first few points until FoCal has enough information to determine a result. From this point, the result should stabilise as more points are added towards the end of the test (the right side of the chart).
The size of the green area gives an indication of the confidence in the result at that point. A large green area spreading across many AF Microadjustment values indicates poor data that will not give an acceptable final result.
Red-Blue Ratio - Fully Auto Calibration | This Page | Image Motion - Fully Auto Calibration