Front/Back Focus - Fully Auto Calibration
(See Chart Features for general chart features - changing scales, copying to clipboard etc)
The Front/Back Focus chart gives an indication of the amount of front or back focus would be experienced at any particular AF Microadjustment value.
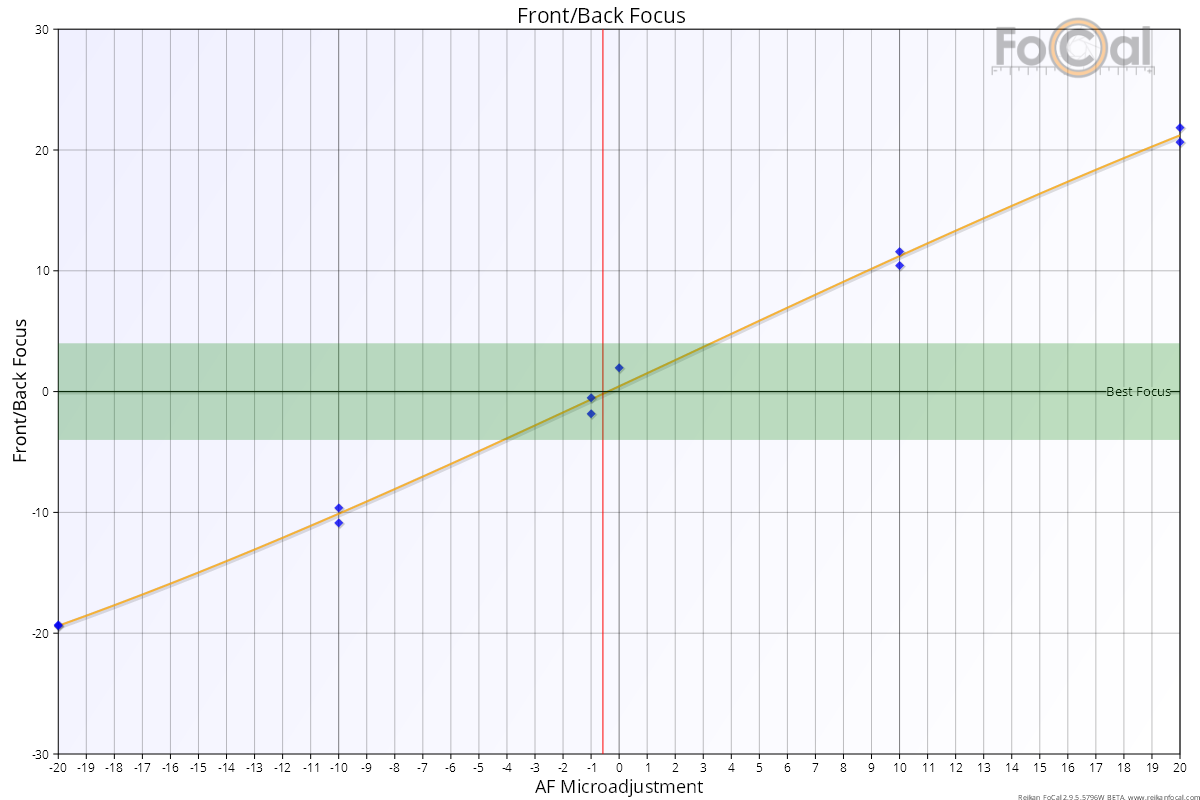
Key:
- Blue markers - individual shot results
- Orange line - the front/back focus at each AF Microadjustment value
- Green area - the approximate depth-of-field of the lens
Basic Interpretation
The green band down the centre is very approximately the range of the depth-of-field, so AF Microadjustment values within this range should give reasonable focus results. In the example above, an AF Microadjustment value between about -4 and +3 would give potentially acceptable results, but by picking the calibration result (the red line at 0) it would mean that a camera focus error equivalent to a few AF Microadjustment points would still result in an acceptably sharp image.
Note: The line is fitted to the average of the data points, and poor quality data can lead to significant deviations of this curve from real focus positions. It's important to interpret this metric in conjunction with the quality of the data - poor focus consistency or poor overall results will mean this metric is of little value.
Further Details
If you are using a camera which supports Dual Pixel AF and the shots are in Raw with the Dual Pixel AF option enabled in the FoCal settings, this information will be derived from the results of analysing the dual-pixel data.
The example below shows a result calculated using Dual Pixel Raw information. The magenta line shows the calculated result and the width of the magenta band shows the result confidence.
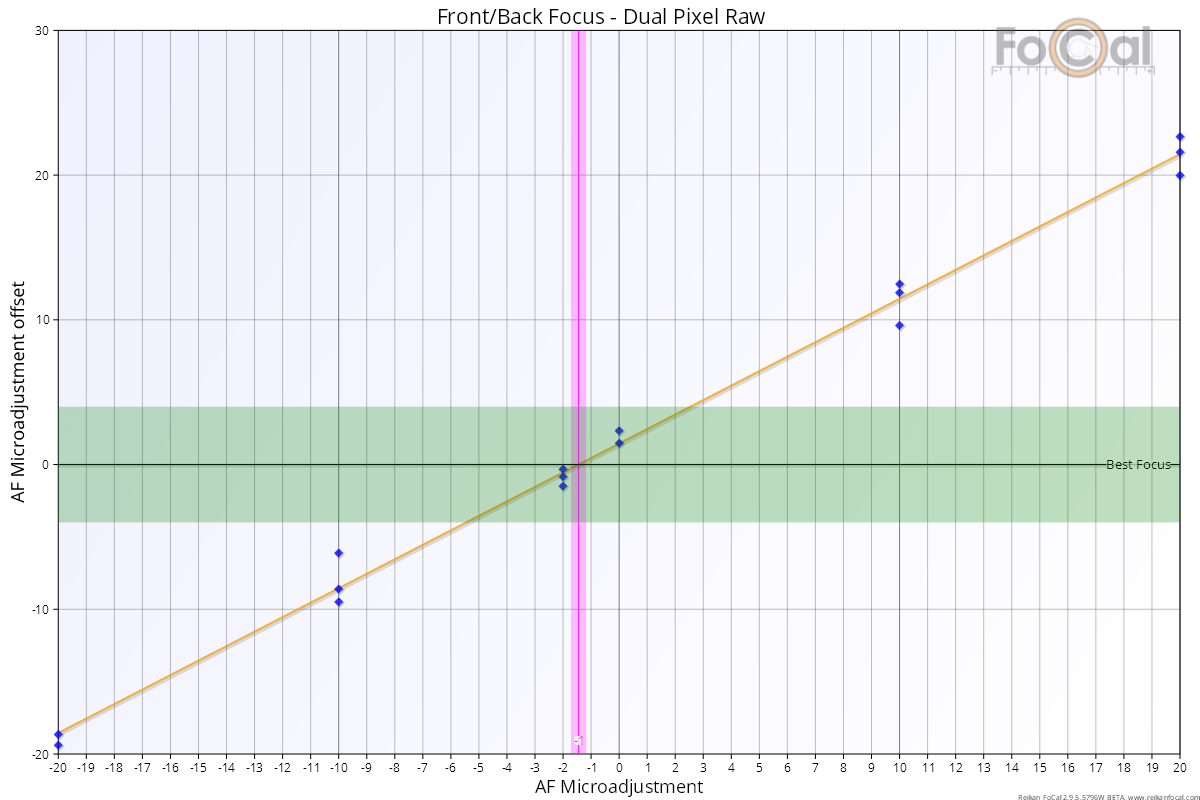
Image Motion - Fully Auto Calibration | This Page