Tripod Effectiveness – Stabilisation Test
(See Chart Features for general chart features - changing scales, copying to clipboard etc)
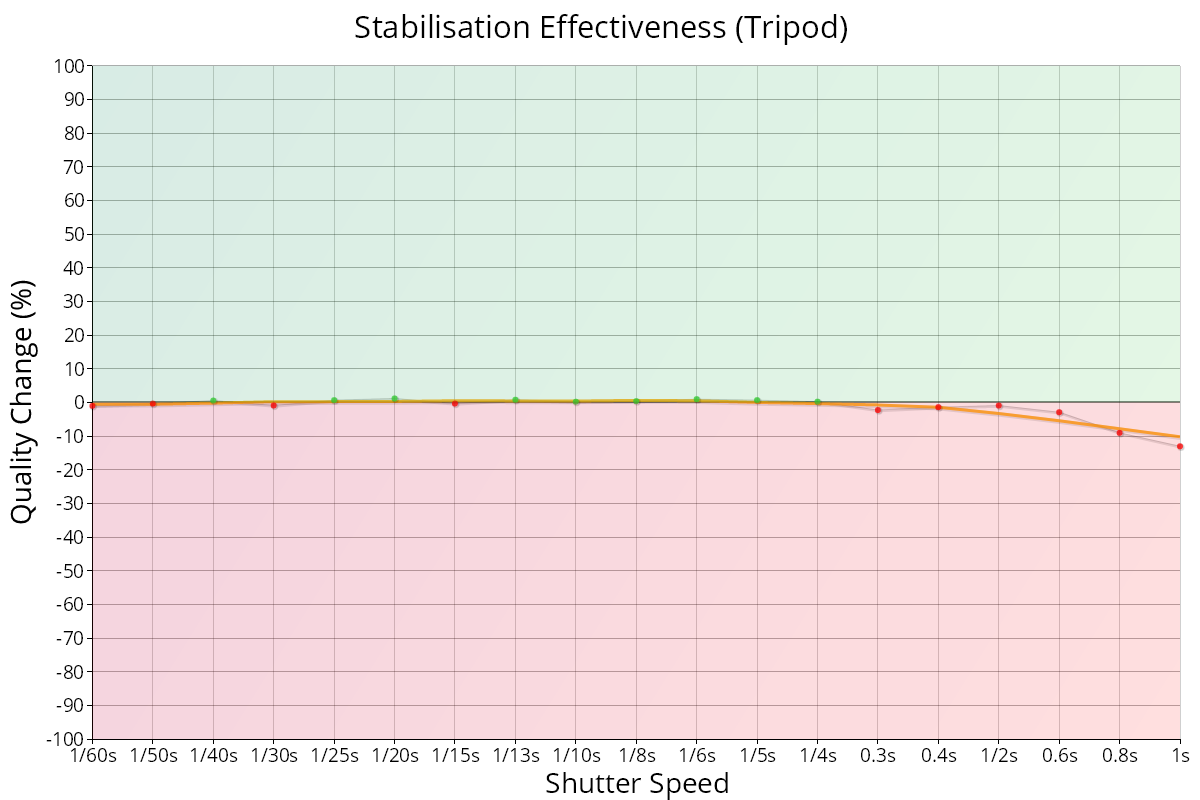
The Tripod Effectiveness chart shows the difference between the quality measurements (as a percentage) when the stabilisation system is on and off.
Key:
- Orange line: smoothed percentage improvement across the shutter speed range
- Green line: raw percentage improvement measured at each shutter speed
- Green markers: points where the quality is improved with stabilisation enabled.
- Red markers: points where quality is degraded with stabilisation enabled.
Interpretation
This chart effectively shows the quality change when the stabilisation system is enabled.
When tripod mounted, stabilisation systems can sometimes adversely affect the image quality by introducing vibration that was otherwise not present.
The example above shows there is an indistinguishable difference between the stabilisation system enabled and disabled up until around 0.4s, but once the shutter speed becomes slower than this the stabilisation system is actually degrading the image quality.
Handheld Effectiveness – Stabilisation Test | This Page | Tripod/Handheld Difference – Stabilisation Test