Quality – Stabilisation Test
(See Chart Features for general chart features - changing scales, copying to clipboard etc)
The Quality chart shows the absolute Quality of Focus value measured at each shutter speed with the stabilisation system On and Off. There are separate charts for handheld and tripod measurements.
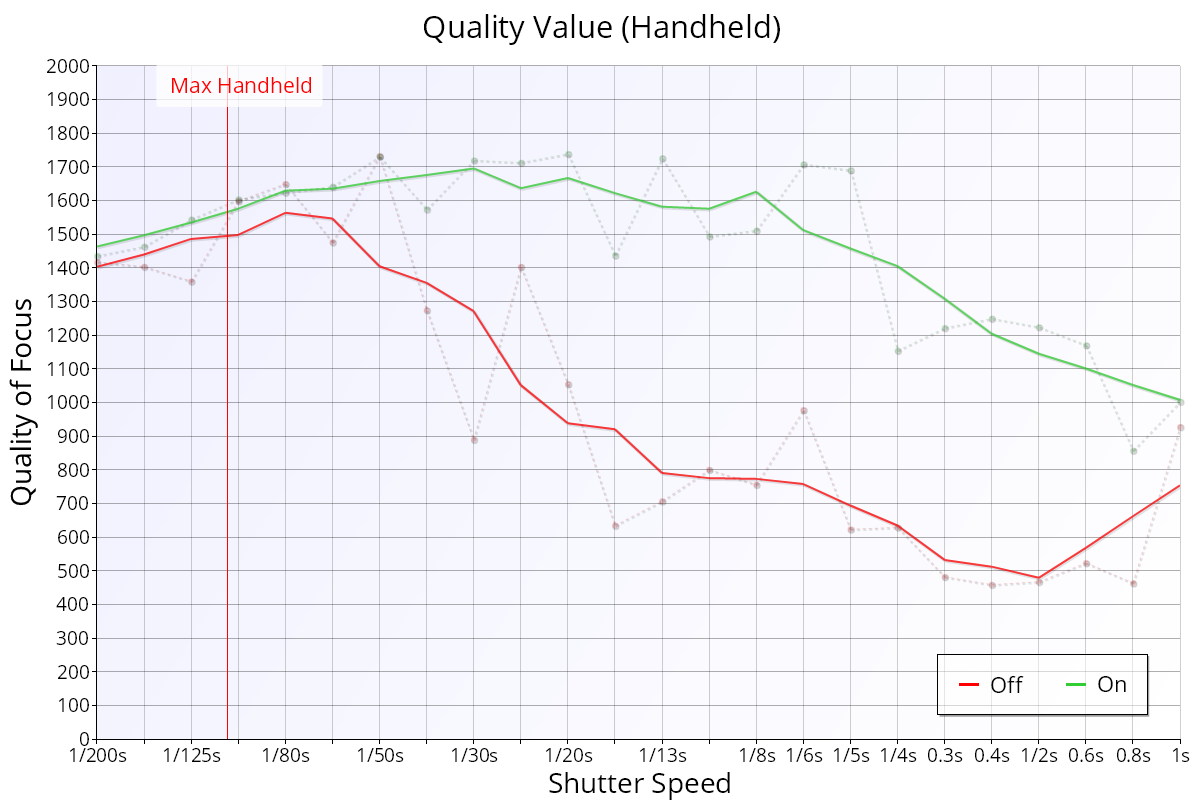
Key:
- Green line: smoothed measurements with stabilisation ON
- Red line: smoothed measurements with stabilisation OFF
- Small points/dotted lines: actual measured values
The Max Handheld marker shows the approximate shutter speed for sharp images when hand-holding the camera, based on the reciprocal rule of 1/focal length, but also compensating for sensor size.
Interpretation
The important metric to look at on this chart is the difference between the red (stabilisation disabled) and green (stabilisation enabled) lines.
The Stabilisation Test works by adjusting both ISO and Aperture to give the largest possible range of Shutter Speed values measured, and it’s important to understand that adjusting ISO and Aperture will affect the absolute value of QoF measured – this accounts for the drop in value at both fast and slow shutter speeds (either sides of the chart) even for tripod-mounted measurements.
In the example above, you can see there isn’t much difference between the red and green lines between 1/200s and around 1/60s, which shows that the stabilisation system isn’t doing much for the image quality at this point.
As the shutter speed slows, the difference between the lines increases to show a much greater quality for the stabilisation-enabled measurements.
You can see a clearer view of this effect here: Handheld Effectiveness – Stabilisation Test and Tripod Effectiveness – Stabilisation Test.
This Page | Handheld Effectiveness – Stabilisation Test