Lens Profile - Fully Auto Calibration
(See Chart Features for general chart features - changing scales, copying to clipboard etc)
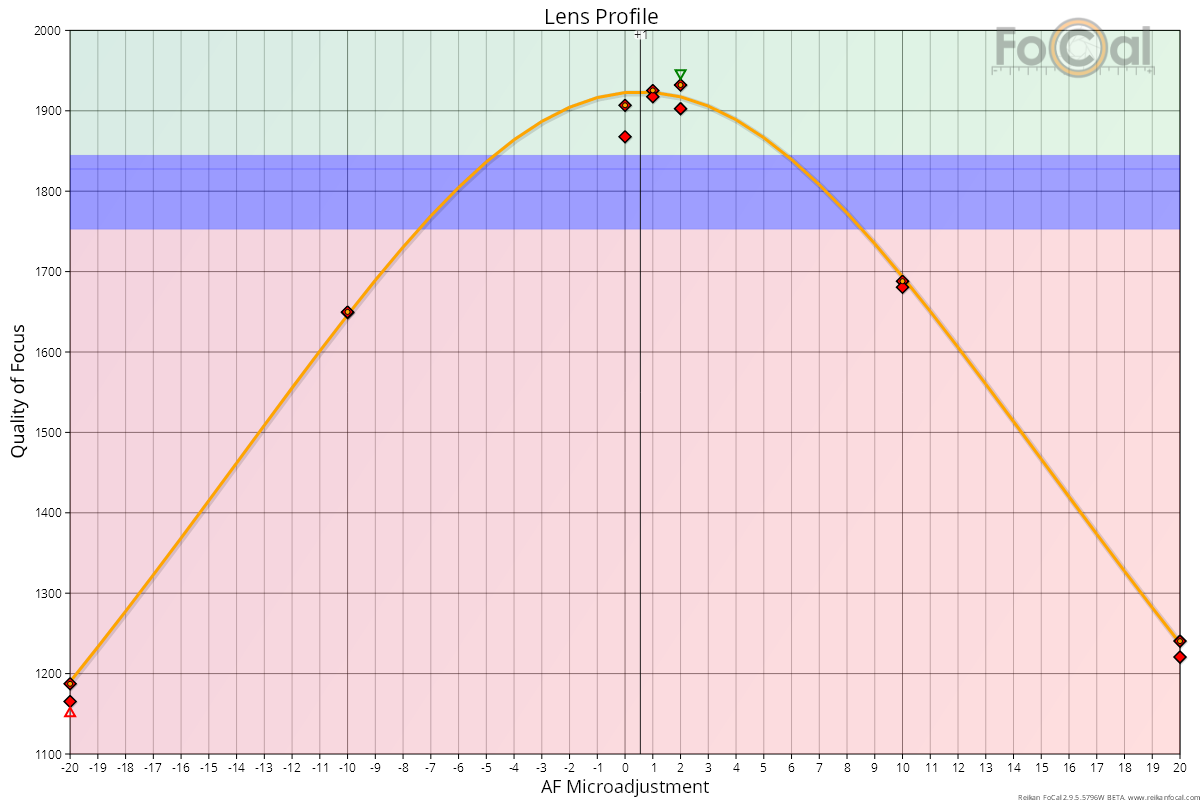
The Lens Profile chart shows how the image quality changes as the AF Microadjustment/Fine Tune value changes. The following is an example of the Lens Profile chart:

- Red diamond: unoptimised sharpness (Target Optimisation disabled)
- Green diamond: optimised sharpness (Target Optimisation enabled)
- Orange circle within diamond - this is the representative sharpness for this AFMA
- Orange curve - the predicted sharpness across the AFMA range
- Green triangle - indicates the highest value
- Red triangle - indicates the lowest value
Where FoCal Comparison Data is available, the horizontal coloured bands indicate how this lens compares to other lenses of the same type on the same camera model:
- Green area - above average performance
- Blue area - average performance
- Red area - below average performance
Basic Interpretation
With the default settings (not displaying RGB data), you will see a single orange line and some markers. The orange line indicates how the sharpness changes across the range of microadjustment values with the highest point being the best sharpness.
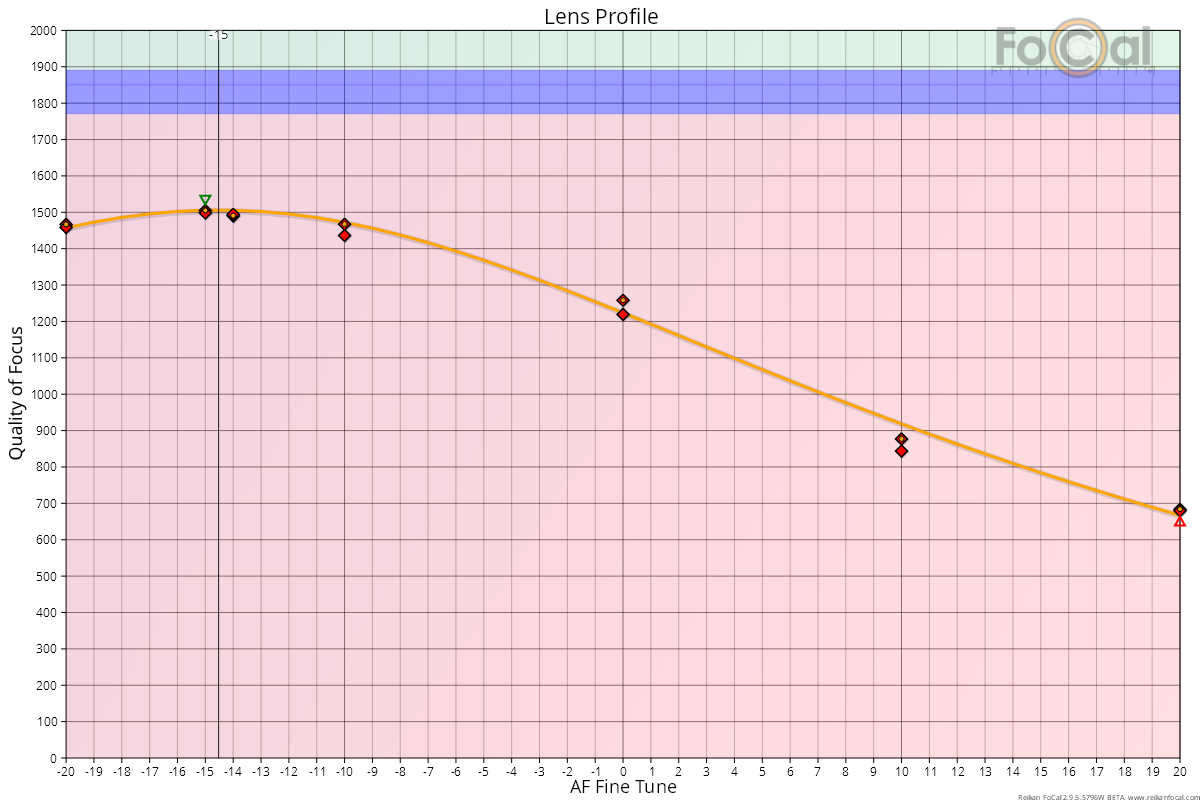
Looking at the example above, the best calibration value is between -14 and -15 (shown by the black vertical line) and corresponds to the highest point on the orange line.
The chart above also shows FoCal Comparison Data results (the horizontal red, blue and green areas). In the example above we can see that this lens is not performing particularly well as all the measured points are in the red area.
Further Details
FoCal Comparison Data Interpretation
The horizontal red, blue and green bands of the FoCal Comparison data allow you to see how your lens is performing compared to the average values of other users of the same camera/lens combination.
For a fully automatic calibration, the bands show the quality level of the best measurement. You should only be comparing the vertical position of the best point from your calibration with the band positions.
In the example below, the best points are in the green area, indicating that the lens - when calibrated - is a little sharper than the average (blue area) for this particular camera/lens combination. This is a good result:
But in the example below, the peak point is a long way down into the red area which indicates we have quite a poor copy of this lens.
Note: You should check the results from other charts and tests in order to confirm that this lens has an issue and that it is not just an unusual result.
RGB Mode (Advanced)
If you have RGB mode enabled (hit CTRL+S to switch this on/off or choose the option in the Preferences window), you will 3 extra curves which represent the sharpness of the images in the red, green and blue channels:
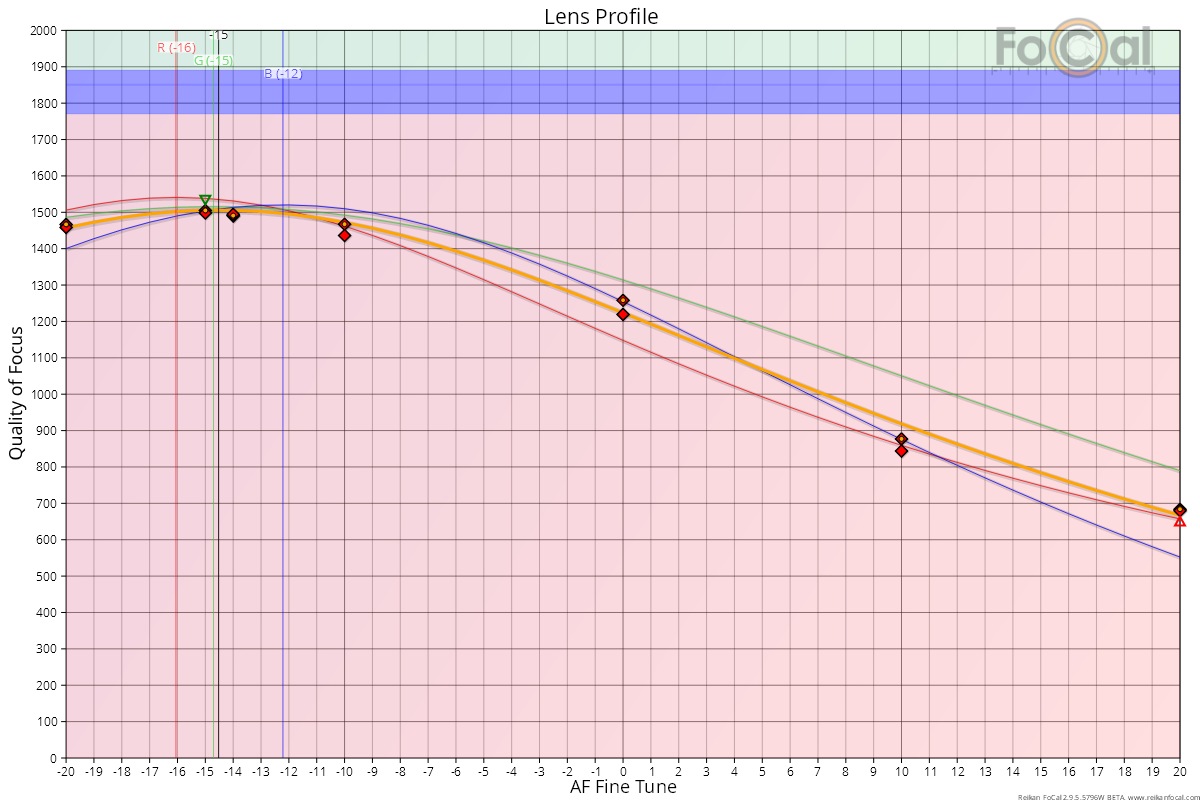
The black vertical line is still present showing the overall result, but you can also see the red, green and blue vertical lines showing the calibration results for each individual channel.
RGB information can be useful in determining appropriate calibration results if lenses exhibit very high degrees of chromatic aberration or if you intend to take photos under unusual lighting conditions.
RGB results are only approximations if you use JPEG as the testing mode as the colour channels cannot be completely separated from a JPEG image. If you wish to analyse RGB results in detail, you should use Raw mode for testing as FoCal uses a custom raw converter to completely isolate red, green and blue information.
Dual Pixel Raw information
If Dual Pixel Raw is enabled both in FoCal and on the supported camera, you will see extra information gathered through analysis of the dual pixel raw information:
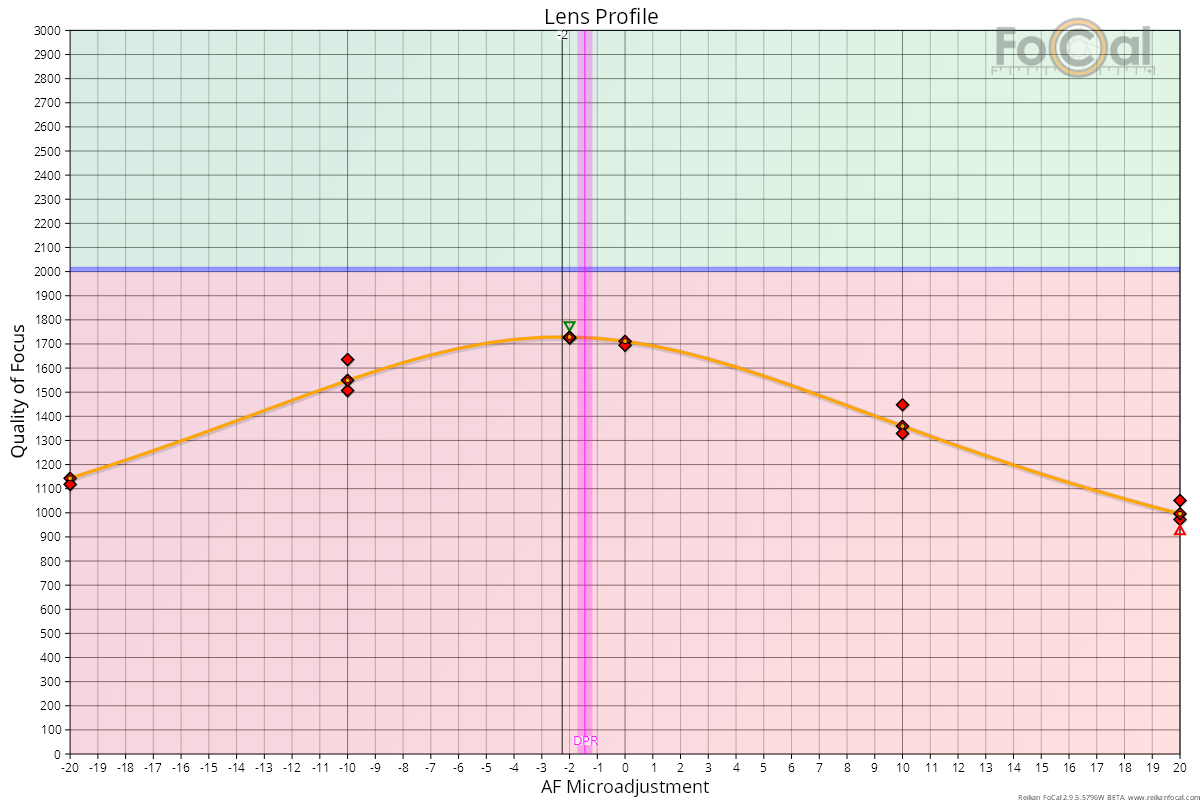
The magenta vertical band shows the dual pixel raw calibration result and the confidence for this value. This result may differ slightly from the FoCal calculated result due to the way it is calculated, but you should expect the FoCal result and the Dual Pixel Raw result to be within about 1 AF Microadjustment unit.
Note that Dual Pixel Raw (as of FoCal 2.6/2.9) is an experimental metric, so you should use the standard FoCal result as the primary source of a calibration result.
This Page | Historic Results - Fully Auto Calibration