Historic Results - Fully Auto Calibration
(See Chart Features for general chart features - changing scales, copying to clipboard etc)
The Historic Results chart shows the results obtained from previous calibrations of this camera and lens. The bars represent previous test results - the taller the bar at any AF Microadjustment, the more popular that result has been as a test result.
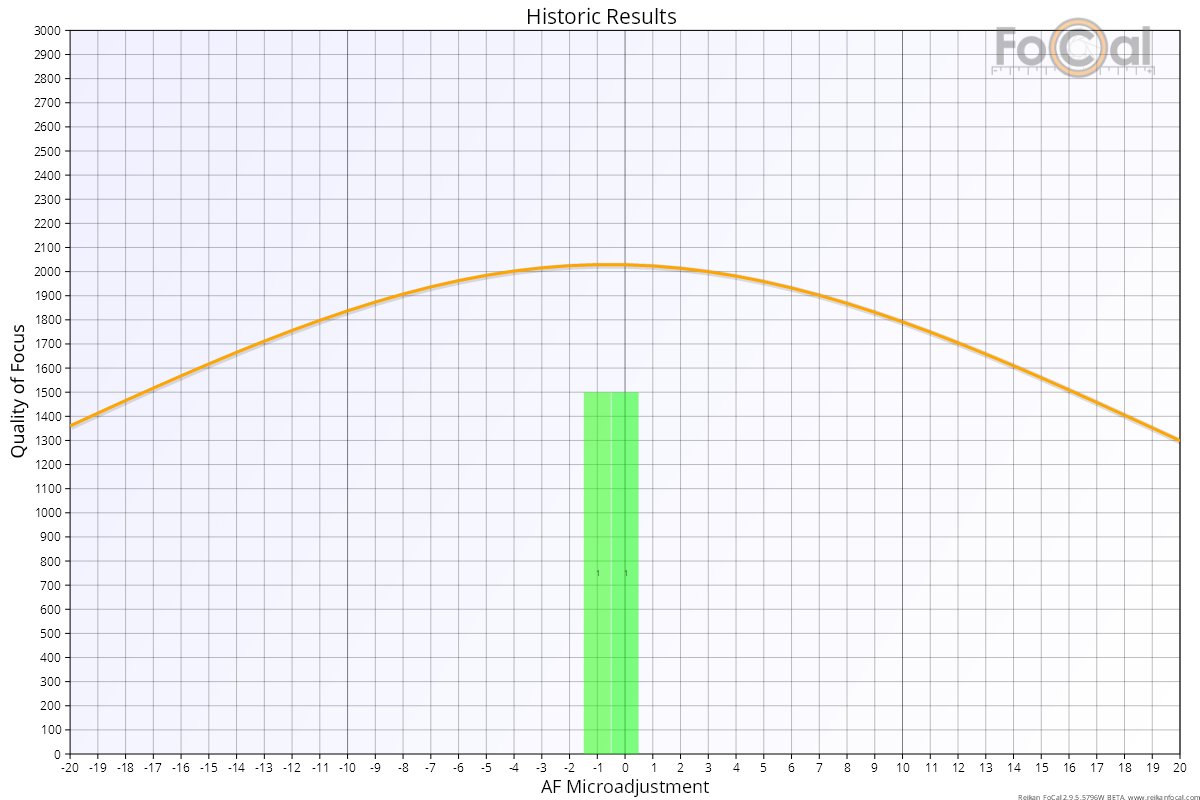
The orange line shows the current Lens Profile, the highest value on this curve being the expected result from this test.
Basic Interpretation
The example above shows that 2 previous tests with this camera/lens combination have yielded results of 0 and -1, and the current result (the peak of the orange curve) is nicely above the two previous results. This indicates that the lens is behaving as it has in the past.
If the markers indicating previous test results are widely spread horizontally, this would indicate a wide spread in previous results and you may have a defective lens.
Also, if your current test result (the peak of the orange curve) is a long way from the general area of any previous results, this may indicate your lens has significantly changed and should be investigated.
Lens Profile - Fully Auto Calibration | This Page | Focus Consistency - Fully Auto Calibration