Focus Consistency - Fully Auto Calibration
(See Chart Features for general chart features - changing scales, copying to clipboard etc)
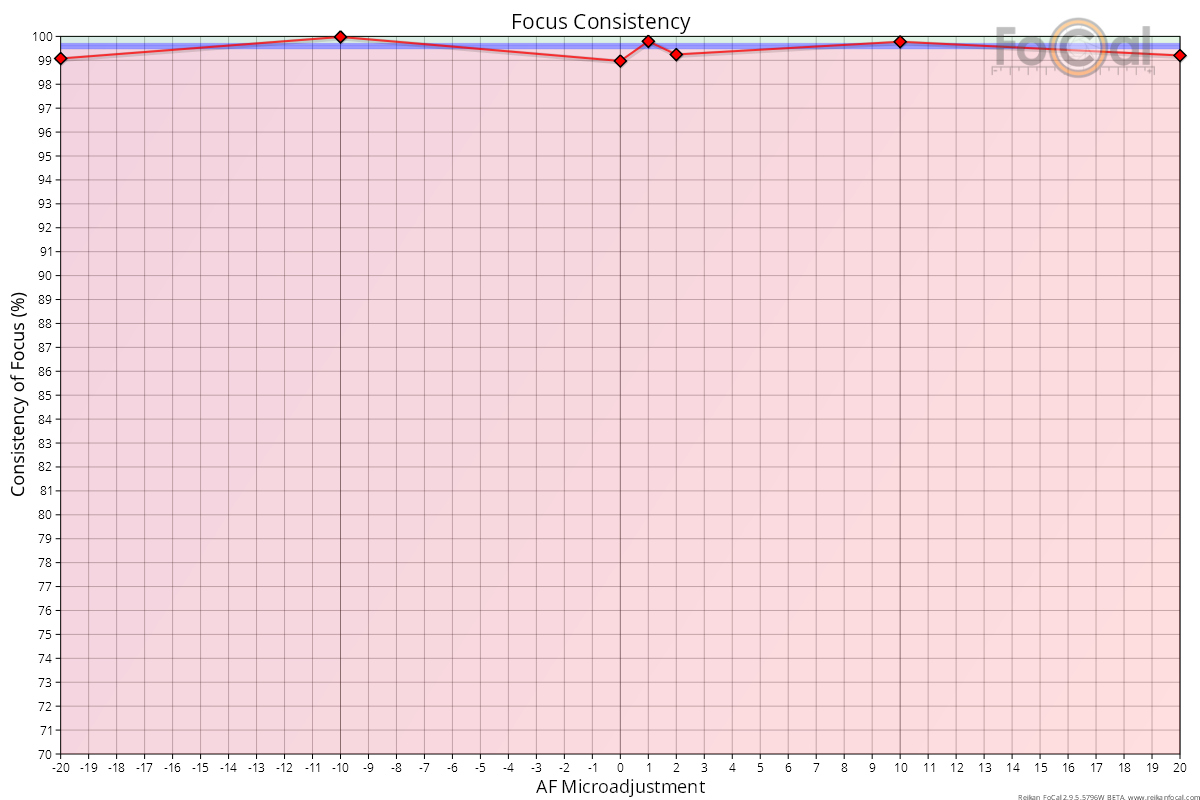
The Focus Consistency chart shows the focus variability at each tested point where available. This is calculated from the spread in sharpness values from shots at a single AF Microadjustment value.
Key:
- Red diamond: unoptimised focus consistency (Target Optimisation disabled)
- Green diamond: optimised focus consistency (Target Optimisation enabled)
- Red diamond / line- the measured focus consistency
Where FoCal Comparison Data is available, the horizontal coloured bands indicate how this lens compares to other lenses of the same type on the same camera model:
- Green area - above average performance
- Blue area - average performance
- Red area - below average performance
Basic Interpretation
A value of 100% indicates perfect repeatability. In normal use, a value above 97% indicates acceptable autofocus repeatability, and above 99% indicate very good repeatability.
Note that the consistency of focus measurement is less relevant far from the best AF Microadjustment value.
The above Focus Consistency chart relates to the following Lens Profile chart from the same test:
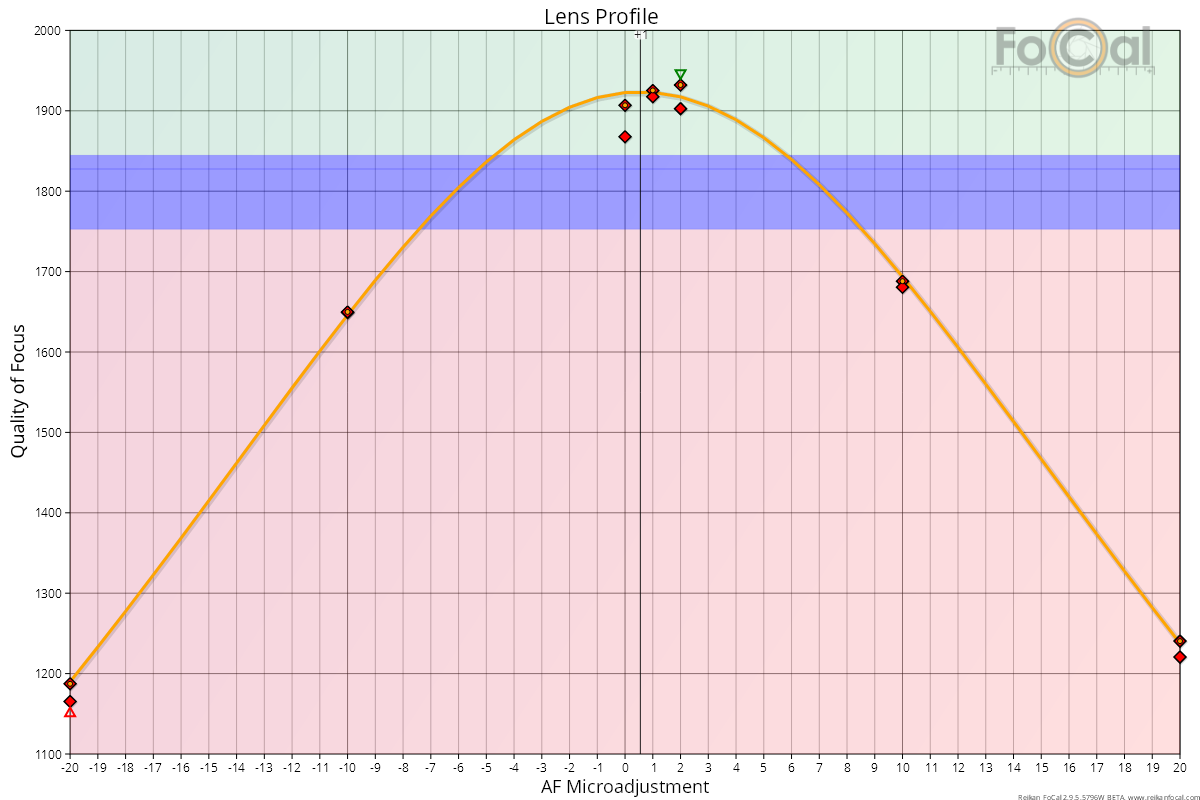
The Focus Consistency chart indicates the vertical “closeness” of the red points (sharpness value) in the chart above. If all the points for a single AF Microadjustment were in exactly the same place (i.e. exactly the same sharpness), the Focus Consistency at that point would be 100%.
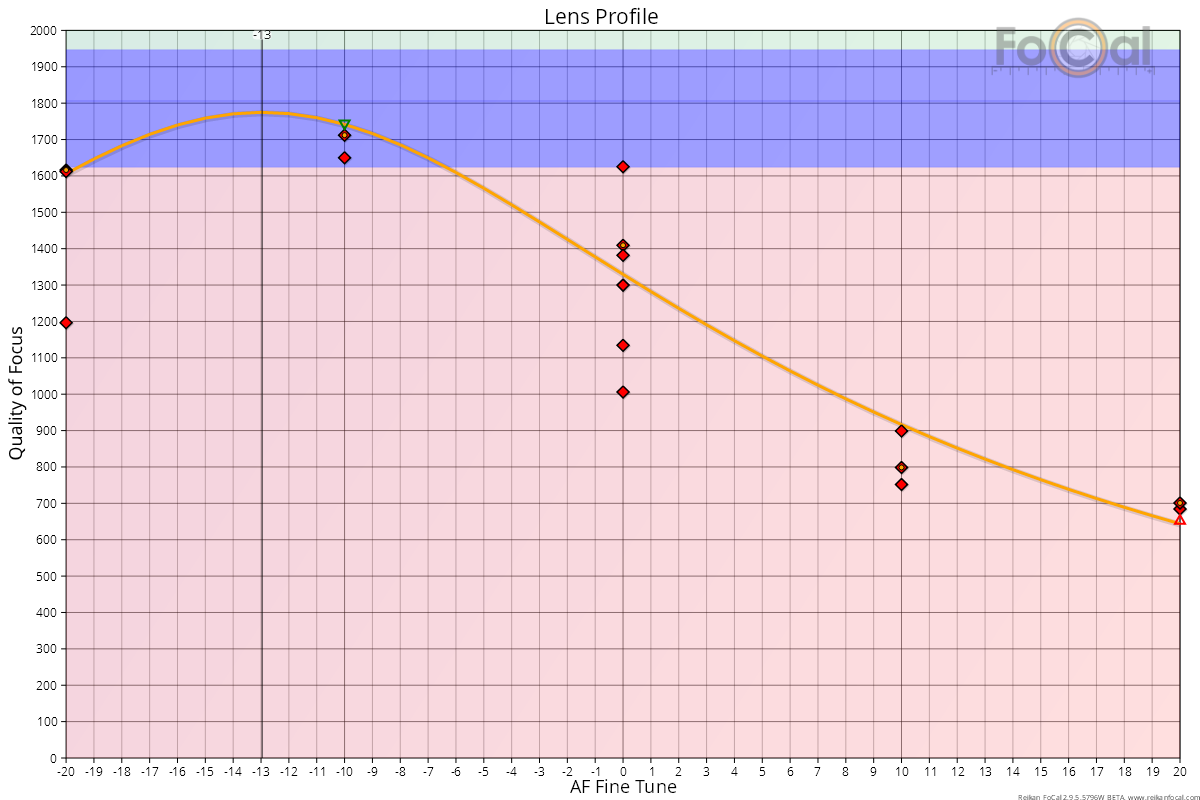
Here’s an example of a poorer result:
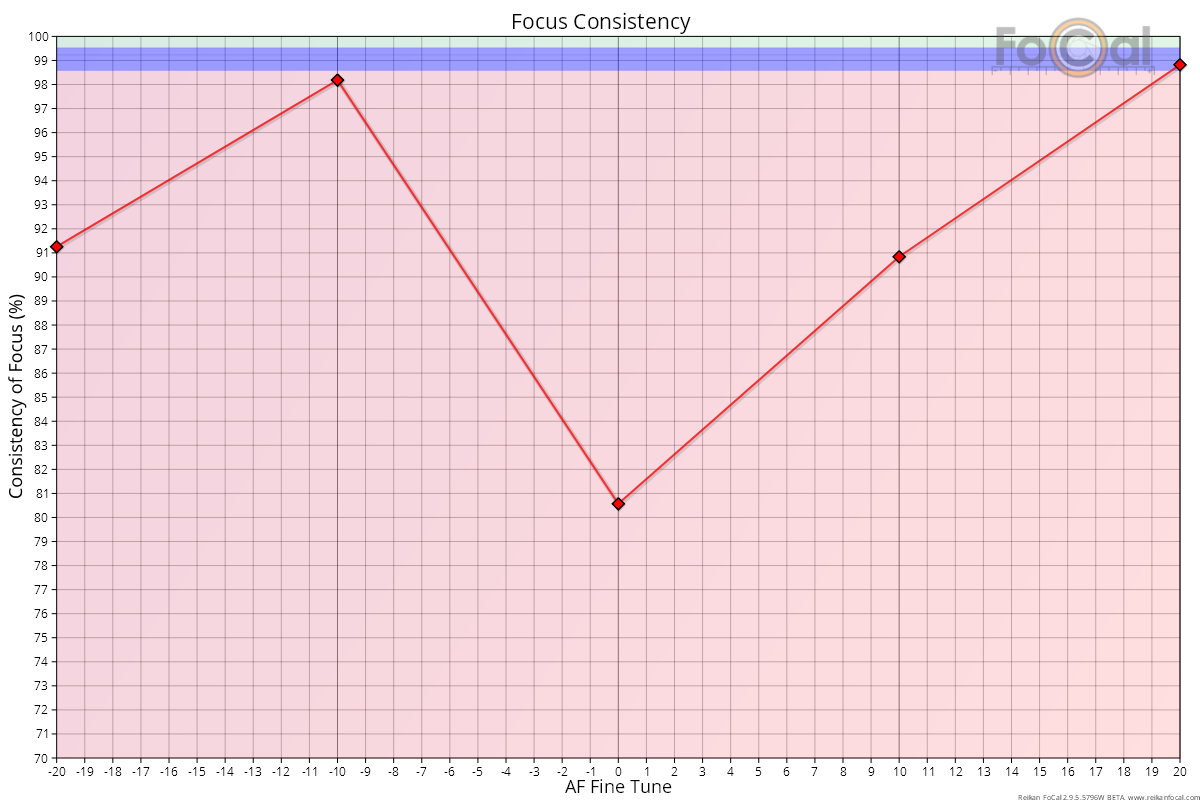
You can clearly see the huge drop in value of the red line away from the top of the chart. And the matching Lens Profile chart shows just how spread the points are (take note especially of AF Fine Tune value 0):
More Details
FoCal Comparison Data Interpretation
The horizontal red, blue and green bands of the FoCal Comparison data allow you to see how your lens is performing compared to the average values of other users of the same camera/lens combination.
For a fully automatic calibration, the bands show the quality level of the best measurement of consistency.
The ideal situation is that the line is mostly on or above the blue area. If a few points are slightly below (as in the first example above) this is not an issue, but if the average is a long way below (as in the second example above) there may be some cause for concern and it should be investigated further.
Historic Results - Fully Auto Calibration | This Page | Astigmatism Factor - Fully Auto Calibration