Astigmatism Factor - Fully Auto Calibration
(See Chart Features for general chart features - changing scales, copying to clipboard etc)
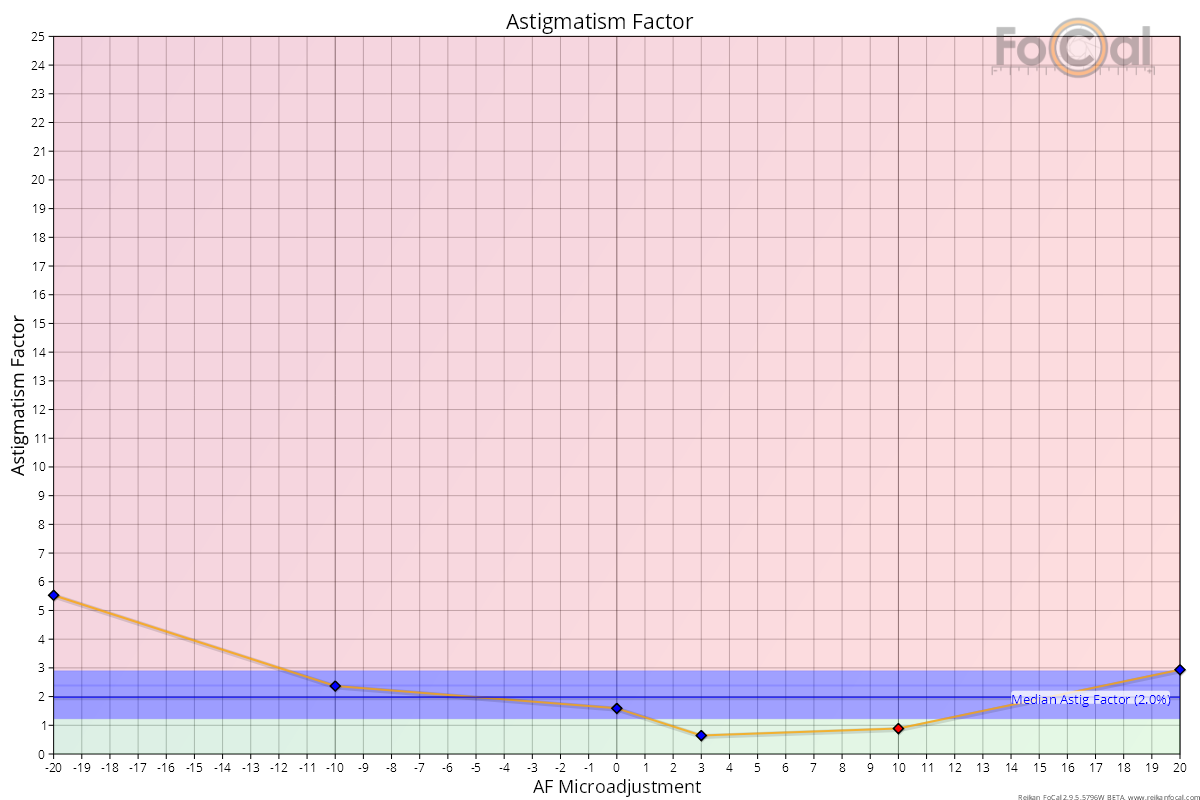
The Astigmatism Factor chart shows the image quality ratio between the horizontal and vertical analysis directions.
Key:
- Red diamond: a point where the horizontal axis is sharper than the vertical axis
- Blue diamond: a point where the vertical axis is sharper than the horizontal axis
- Blue Line: median (average) astigmatism factor
Where FoCal Comparison Data is available, the horizontal coloured bands indicate how this lens compares to other lenses of the same type on the same camera model:
- Green area - above average performance
- Blue area - average performance
- Red area - below average performance
Basic Interpretation
The Astigmatism Factor is an absolute indication of the difference between the horizontal and vertical sharpness. This means that a difference in either direction will increase the Astigmatism Factor value (height vertically on the chart). In order to determine the sharpest axis, the points are coloured as shown in the key above.
Some increase in Astigmatism Factor is not unusual as the image becomes very blurred far away from the appropriate calibration value. But a good quality, well aligned lens should not differ by much even as it defocuses. A good guide is that if the value varies by more than about 10% across the whole range of AF Microadjustment values, or the blue Median line is greater than about 5% then you should investigate further, checking things like calibration repeatability, autofocus consistency and general quality when shooting various real-world objects.
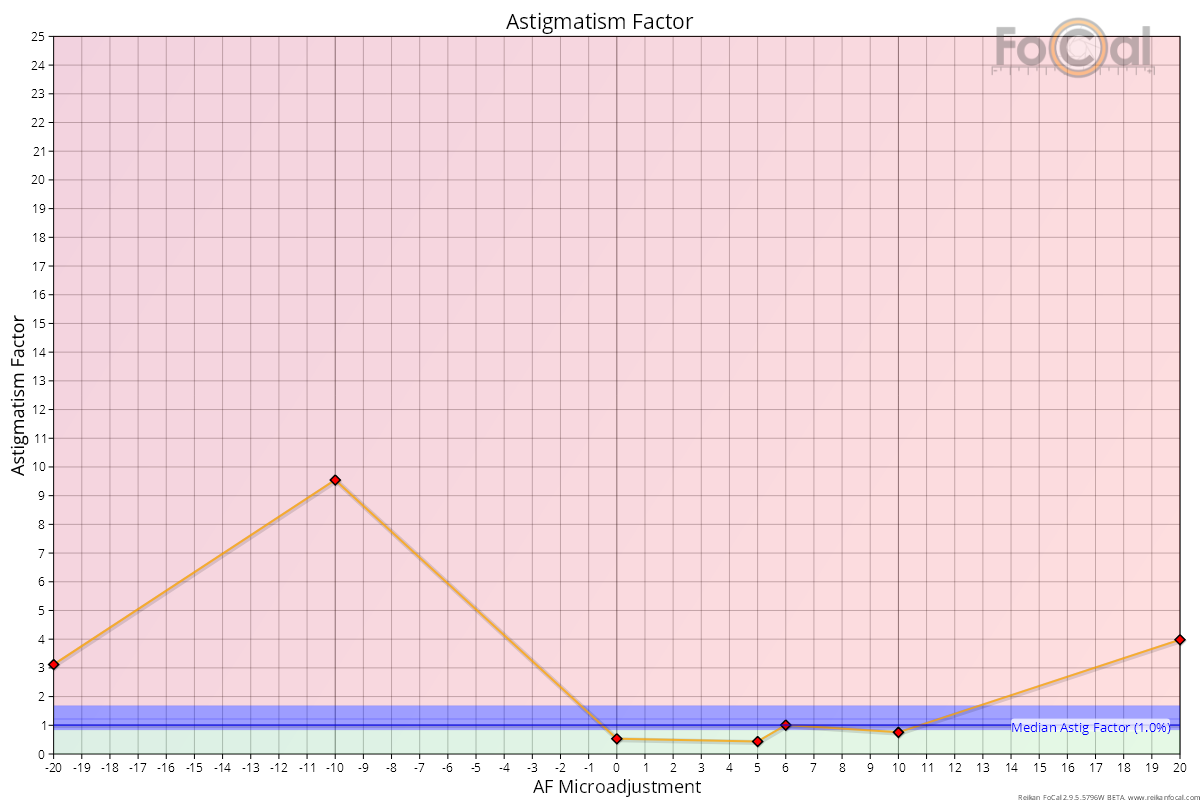
Vibration
Astigmatism Factor can also indicate that the camera is experiencing high levels of vibration during a test. This is typically shown by a high value (>5%) of Astigmatism Factor at some points but not necessarily all of them. Typically the points will show as red diamonds if vibration is the cause - this means the blurring is in the vertical axis which is what you would usually expect from a vibrating setup.
As an example, the chart below shows a test that was deliberately vibrated at the -20, -10 and +20 points. Subsequently, the Astigmatism Factor is considerably higher than average at these points.
Focus Consistency - Fully Auto Calibration | This Page | Red-Blue Ratio - Fully Auto Calibration