Lens Profile – Aperture Sharpness
(See Chart Features for general chart features - changing scales, copying to clipboard etc)
The Aperture Sharpness Profile shows how the image sharpness changes across the tested aperture range.
Key:
- Red diamond: unoptimised sharpness (Target Optimisation disabled)
- Green diamond: optimised sharpness (Target Optimisation enabled)
- Red line - the sharpness profile across the aperture range
- Vertical red line - diffraction limit
- Green triangle - indicates the highest value
- Red triangle - indicates the lowest value
Where FoCal Comparison Data is available, the horizontal coloured bands indicate how this lens compares to other lenses of the same type on the same camera model:
- Green area - above average performance
- Blue area - average performance
- Red area - below average performance
Basic Interpretation
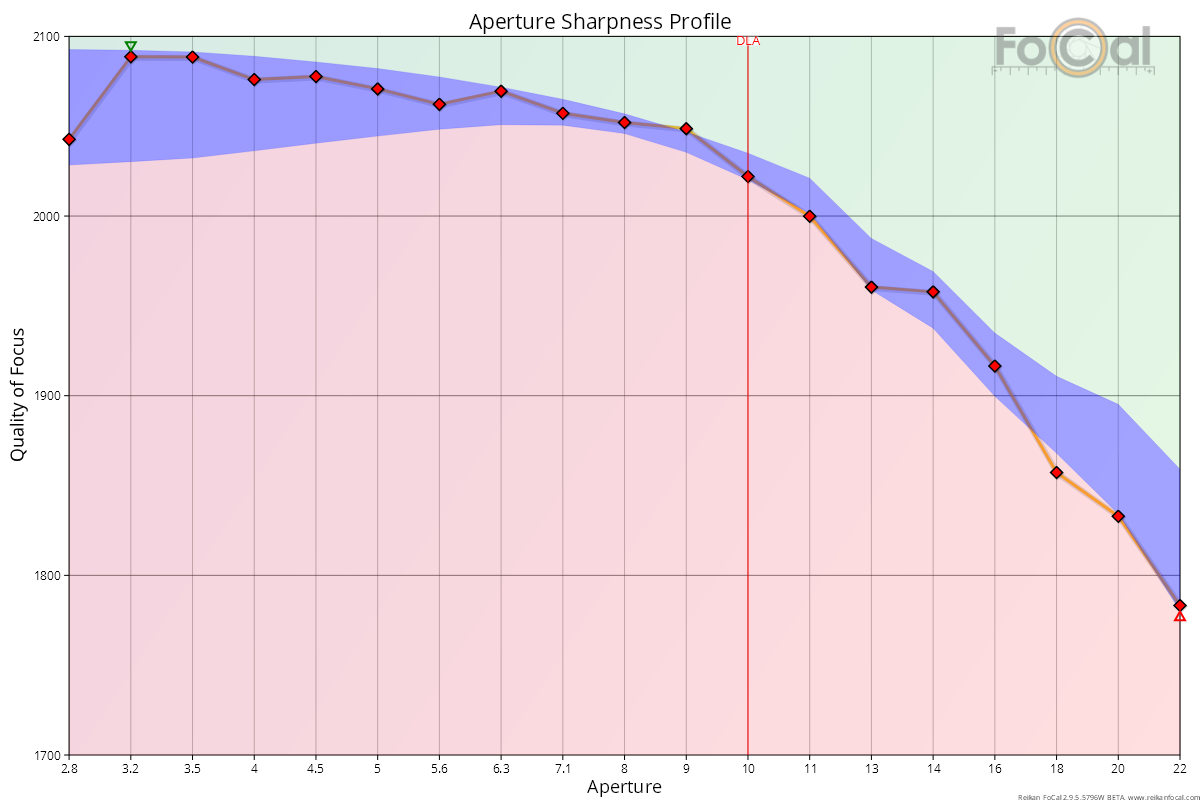
The left hand side of the chart represents the sharpness of the lens with the aperture wide open (in the example above this is f/2.8). As you progress across the chart to the right, the aperture is closing down in size, represented by the larger f-number (through to f/22 in the example above).
The shape of the chart above is fairly typical for a lens that does not have a super-wide aperture (e.g. < f/1.8). The best sharpness is usually around f/5.6-f/8, with either a slight drop or a fairly stable level between here and wide open.
The vertical red line indicates the point where diffraction will start to soften the image and you will see a drop with almost every lens from around this point to the right side of the chart (the smallest aperture).
Further Details
FoCal Comparison Data Interpretation
The chart above also shows FoCal Comparison Data results (the horizontal red, blue and green areas). In the example above the lens is performing perfectly within the blue area meaning it is giving good, appropriate sharpness across the aperture range as compared to other users.
You should not expect the lens profile to fit perfectly within the blue area - most of the time it will take on a shape roughly representative of the blue section. The example above is particularly good in that the red line almost entirely fits within the blue area.
You should take note if the red line is significantly below the blue area for most of the chart. The Comparison Data Difference chart gives another way of visualising this.
“Fast” (very wide aperture) Lenses
The following chart shows the typical results from a fast (wide aperture) lens:
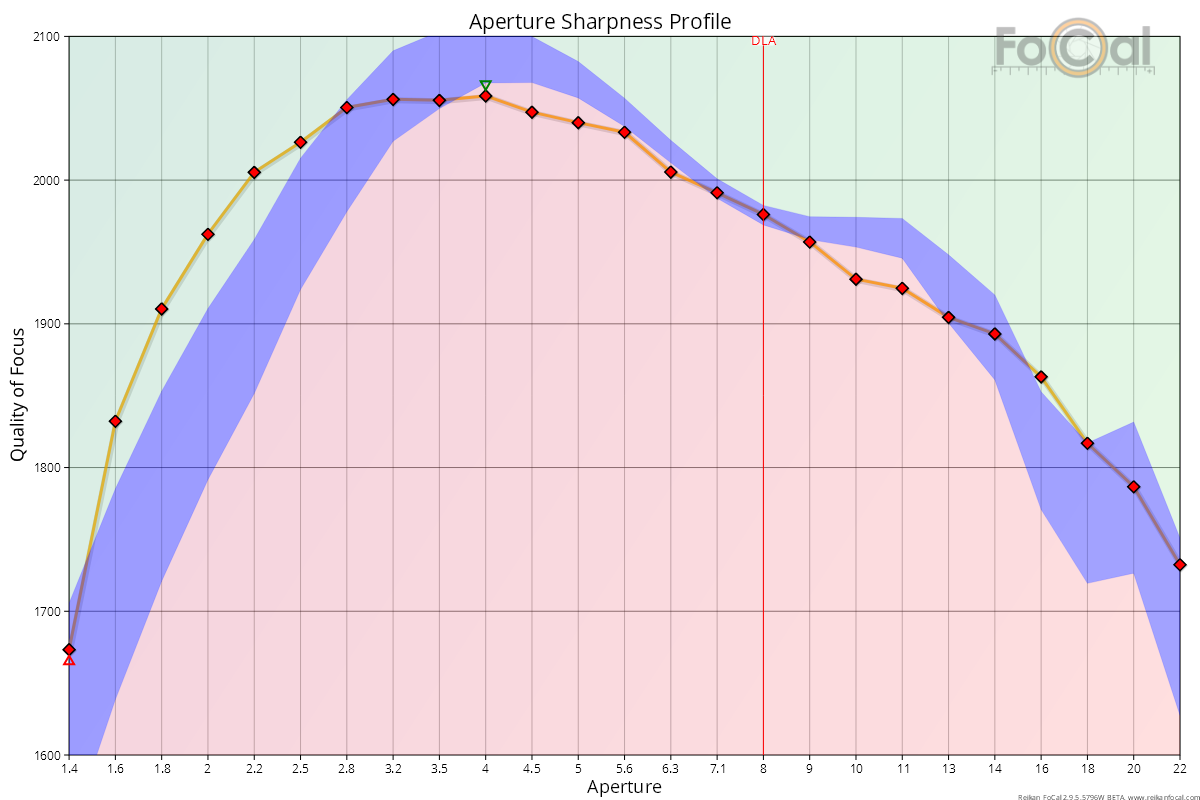
Unlike the first image, you can see a significant drop on the left side of the aperture sharpness profile, which indicates a considerable drop in sharpness as the lens opens wider than around f/2.8. This is very typical for fast lenses – they do allow very wide apertures, but this usually compromises image sharpness.
Incorrectly Focused Lens
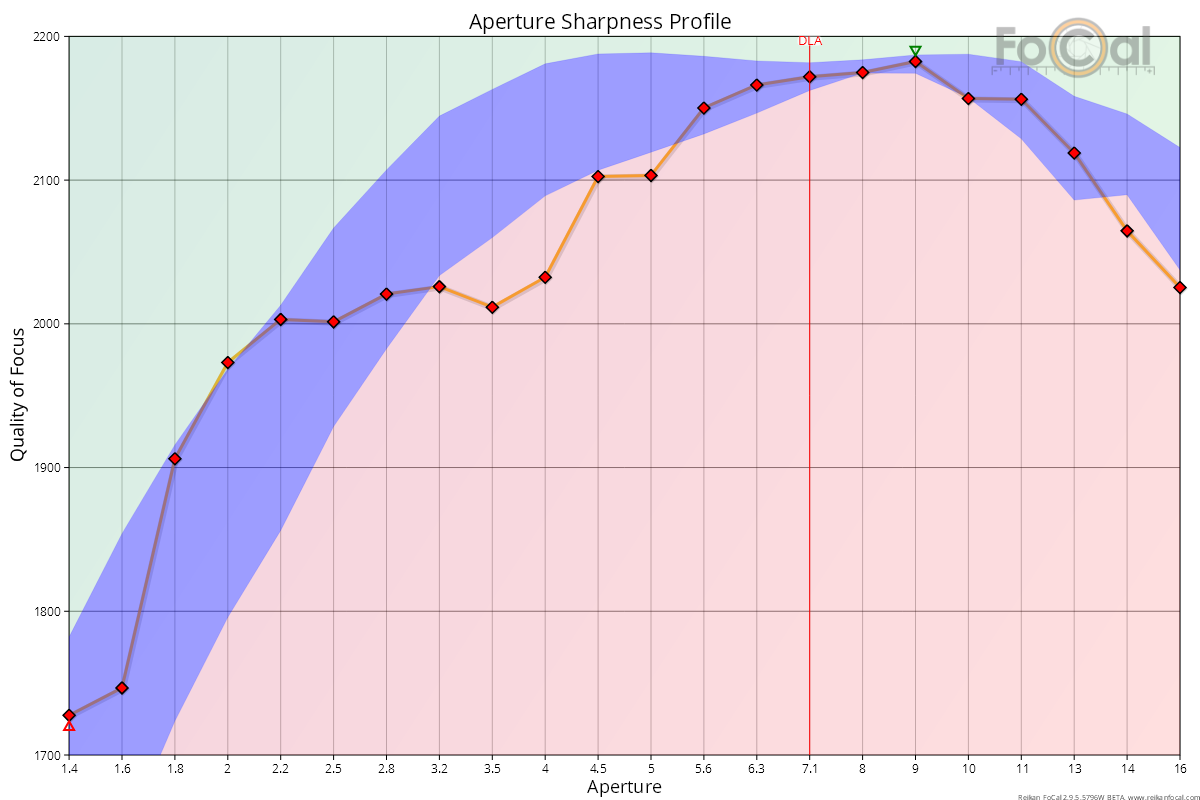
The Aperture Sharpness test will only produce representative information if the lens is focused as accurately as possible on the target before the test is run. The Target Setup utility will help you achieve this, but the process is manual and can be subject to some error.
If the focus is significantly away from “perfect”, you may notice odd “kinks” in the red line of the chart, as in the example below. If you see this sort of behaviour in the results, it would be worth re-checking the initial focus and rerunning the test. There are a few lenses which have slightly odd aperture sharpness profiles, but most standard types of lenses will have the usual curve shape shown in the above two examples.
This Page | Astigmatism Factor – Aperture Sharpness