Quality & Shift – MultiTest
(See Chart Features for general chart features - changing scales, copying to clipboard etc)
The Quality & Shift chart the quality of a measurement point across the focus and aperture range, delineated at 5% quality boundaries.
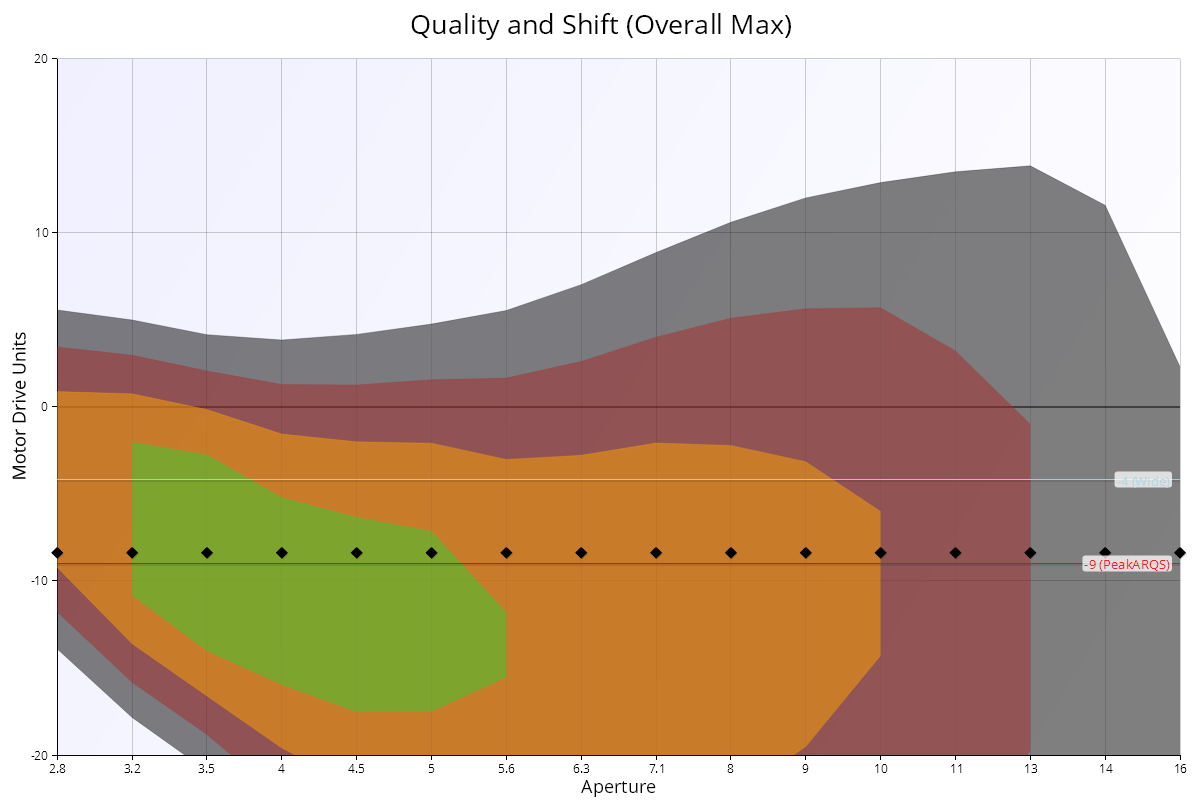
The coloured areas represent:
- Green = 95-100%
- Orange = 90-95%
- Brown = 85-90%
- Gray = 80-85%
- White = below 80%
When the chart is Overall Max type, the value represents quality percentage of all measurement of the test.
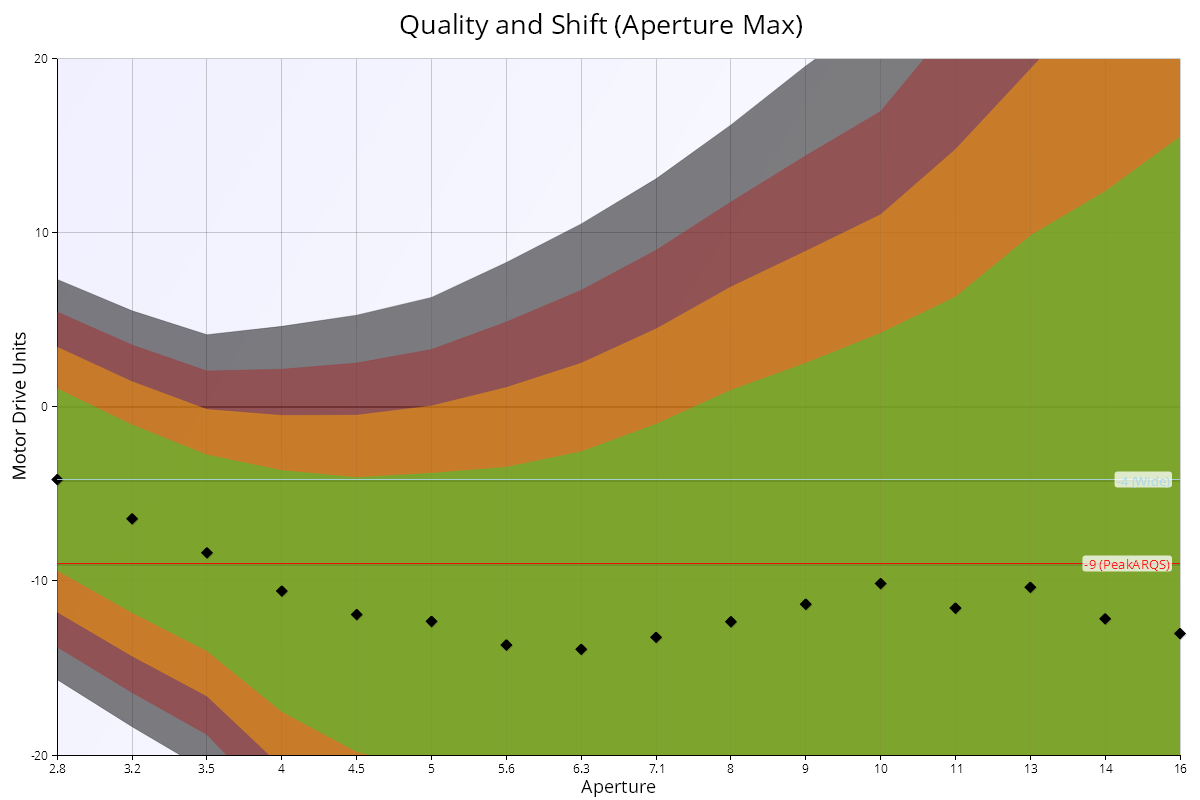
When the chart is Aperture Max type, the value represents quality percentage of just the values for the specified aperture.
Key:
- Purple diamonds – location of the peak quality value for each aperture
- White diamond – location of the overall best quality point for the whole test
- Blue line – focus adjustment value for the best quality wide open (this is the same as a “classic” focus calibration value)
- Red line – focus adjustment value for the best Aperture Range Quality Score which represents the best average quality over the whole aperture range.
The same data above show as the Aperture Max chart type is as follows:
Interpretation
As the data is very similar, please see Quality Grid – MultiTest for further details on interpretation of this type of chart.
Quality Grid – MultiTest | This Page | Aperture Range Quality Score (ARQS) – MultiTest