Red-Blue Ratio – MultiTest
(See Chart Features for general chart features - changing scales, copying to clipboard etc)
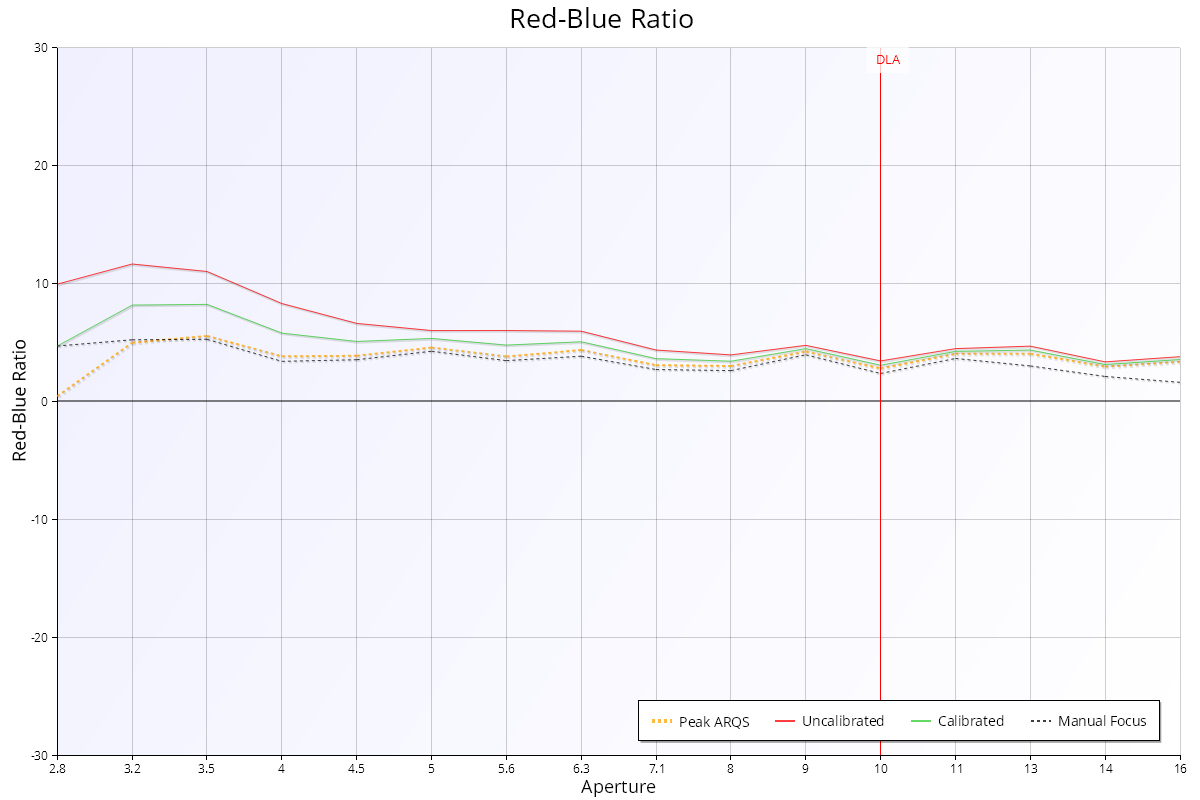
The Red-Blue Ratio chart shows the comparison between the analysis quality in the red channel and the analysis quality in the blue channel. It can be used to give an indication of lens aberrations.
Key:
- Red line: uncalibrated red-blue quality ratio (adjustment value is 0)
- Green line: calibrated red-blue quality ratio
- Black dotted line: red-blue quality ratio with manual focusing at any aperture
- Orange dotted line: red-blue quality ratio at ARQS calibration value (see Aperture Range Quality Score (ARQS) – MultiTest).
Interpretation
In order to get a perfectly focused image, all light rays of all visible colours must converge on the same point on the sensor.
To explain this, imagine focusing on a circular white light against a black background.
If every colour if perfectly focused, the sensor will be exposed to a perfect white circle.
But in real-world lens design, all points are not focused at the same place, which means different colours actually produce a blurred circle on the sensor.
Take the example where the green component of the light is perfectly focused, but the red and blue are focused a little in front of the sensor and a little behind the sensor respectively.
You’d end up with a perfect green circle, and a (slightly) blurred red and blue circle overlaid – red and blue mixed together gives purple, so you’ll have a hazy purple outline to a point source on your lens. This is known as axial or longitudinal chromatic aberration.
What does the chart show?
The Red-Blue Ratio chart in FoCal simply shows the difference between the sharpness in the red and blue channel.
If the red image is sharper, the point will be above the zero line.
If the blue image is sharper, the point will be below the zero line.
You would typically expect the lens to be designed to focus green light correctly as this falls within the middle of the visible spectrum, so by comparing the red and blue values you can see if a lens is exhibiting aberrations that are likely to result in colour fringing around objects.
Astigmatism Factor – MultiTest | This Page | Red Quality – MultiTest