Focus Steps – MultiTest
(See Chart Features for general chart features - changing scales, copying to clipboard etc)
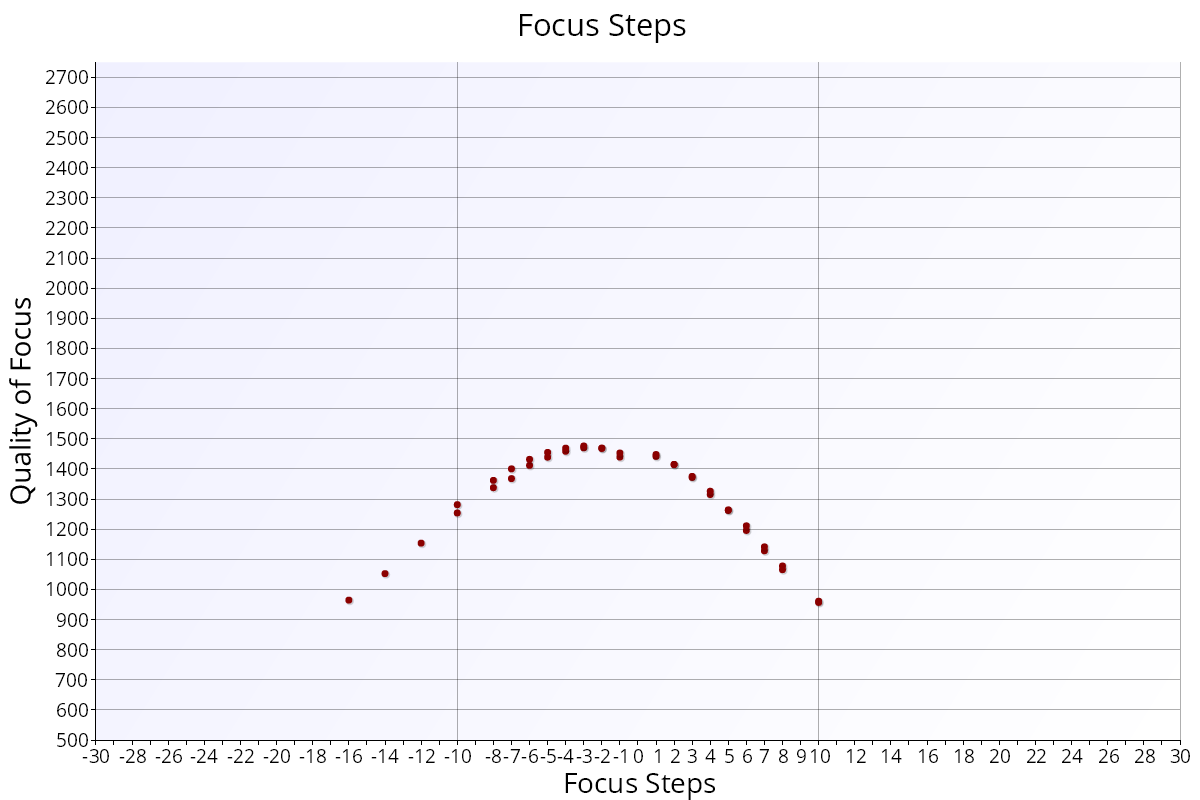
The Focus Steps chart shows the result of driving the lens focus to the required position, and can give an indication of lens hysteresis and live-view focus offset.

Key:
- Red markers – focus quality
Interpretation
The 0 value on the horizontal axis indicates the result of Live View focus.
Negative values show focus moving towards the camera, and positive values focus moving away from the camera.
There are usually 2 focus drives in each direction.
The chart above shows that in on instance, there was a significant amount of lens drive hysteresis (where the lens is told to move but it does not for several steps – this is shown by the flat area of points from the 0 line towards the left of the chart.
For some lenses, the Live View focus position will not be at the peak, and this indicates that the lens and/or camera may need calibration of it’s live view focus capability.
This example shows a Canon EF 85mm f/1.2L II lens on a Canon EOS-R camera, and clearly shows that the peak of the curves is NOT at the zero point, but more like the -4 or -5:
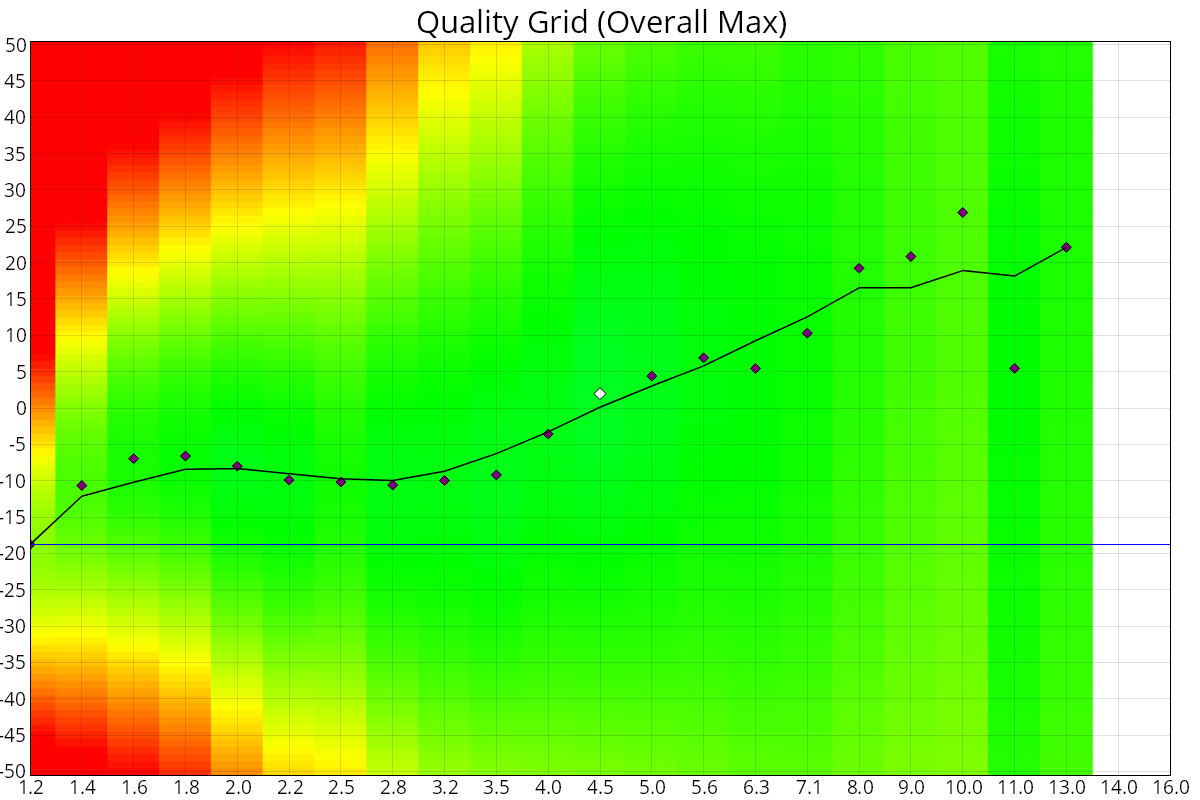
Where this is the case, you will see an offset to the peak focus position on the Quality Grid, here you can see that the best wide-open focus is actually with the lens at a focus offset of -20